 English
  Русский
 Bahasa Indonesia
 Bahasa Malay
 ไทย
ไทย Español
 Deutsch
 Български
 Français
 Tiếng Việt
 中文
中文 বাংলা
বাংলা हिन्दी
 Čeština
 Українська
 Română

Latest data released by the ECB - 27 October 2020
Prior +9.5%
Slight delay in the release by the source. Broad money growth continues to swell, with the annual change reflecting the biggest jump since December 2007.
Meanwhile, loans to households also increased to +3.1% y/y while loans to corporates were steady at +7.1% y/y.

Further Development
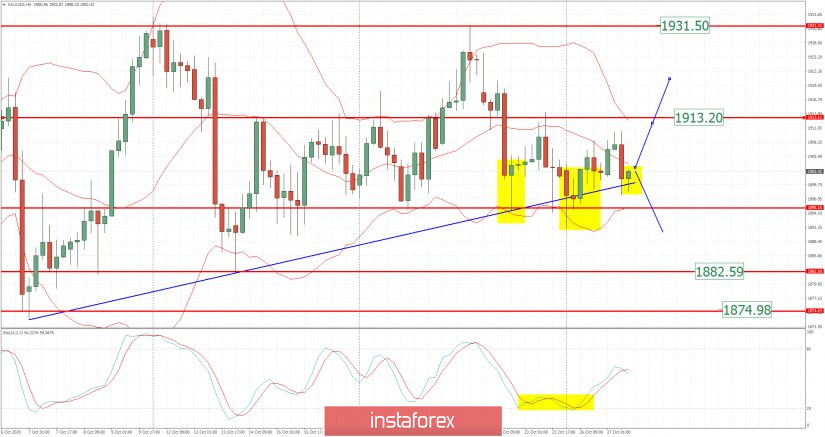
Analyzing the current trading chart of Gold, I found that the Gold is testing the support trendline at $1,900 but that price is still in consolidation and you should watch for the breakout to confirm further direction.
1-Day relative strength performance Finviz
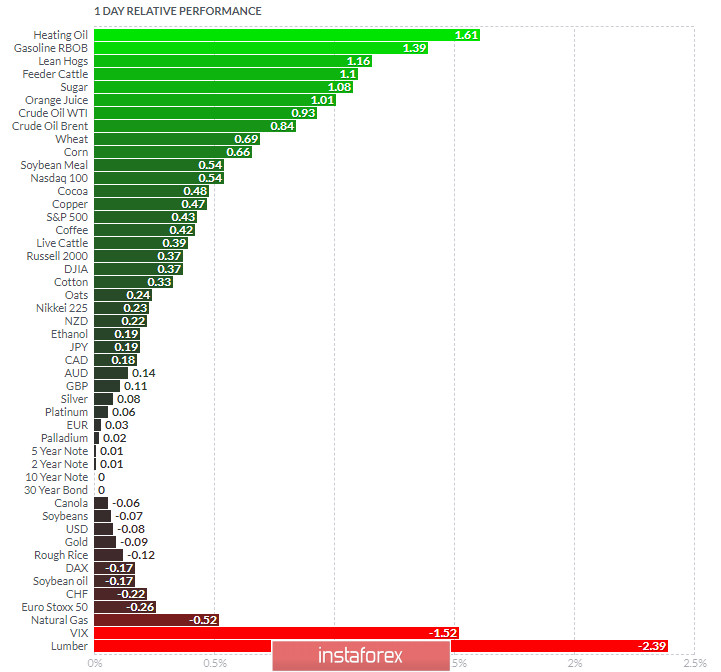
Based on the graph above I found that on the top of the list we got Heating Oil and Lean Hogs today and on the bottom Lumber and VIX.
Gold looks neutral today on the relative strength list...
Key Levels:
Resistance: $1,913
Support levels: $1,895