 English
  Русский
 Bahasa Indonesia
 Bahasa Malay
 ไทย
ไทย Español
 Deutsch
 Български
 Français
 Tiếng Việt
 中文
中文 বাংলা
বাংলা हिन्दी
 Čeština
 Українська
 Română

The pair is trading in the flat range throughout November, which makes it possible to fix deals at monthly extremes. At the end of last week, the pair reached the November low. However, it was not tested, which allows the consideration of a further decline.
Medium-term plan.
The main purpose of the downward movement remains to be shorting the weekly target at 1.2657-1.2540 for short-term. A test at this level would require closure majority of short-positions. In case of a large emergence, purchases will come to the fore with the aim of reaching the October maximum which is after the test of the above-mentioned zone and the formation of the reversal pattern. To continue the downward movement, it is necessary to consolidate below the level of 1.2640 during one of the American sessions. If this happens, the target of the fall will become the monthly KZ November at 1.2507-1.2462.
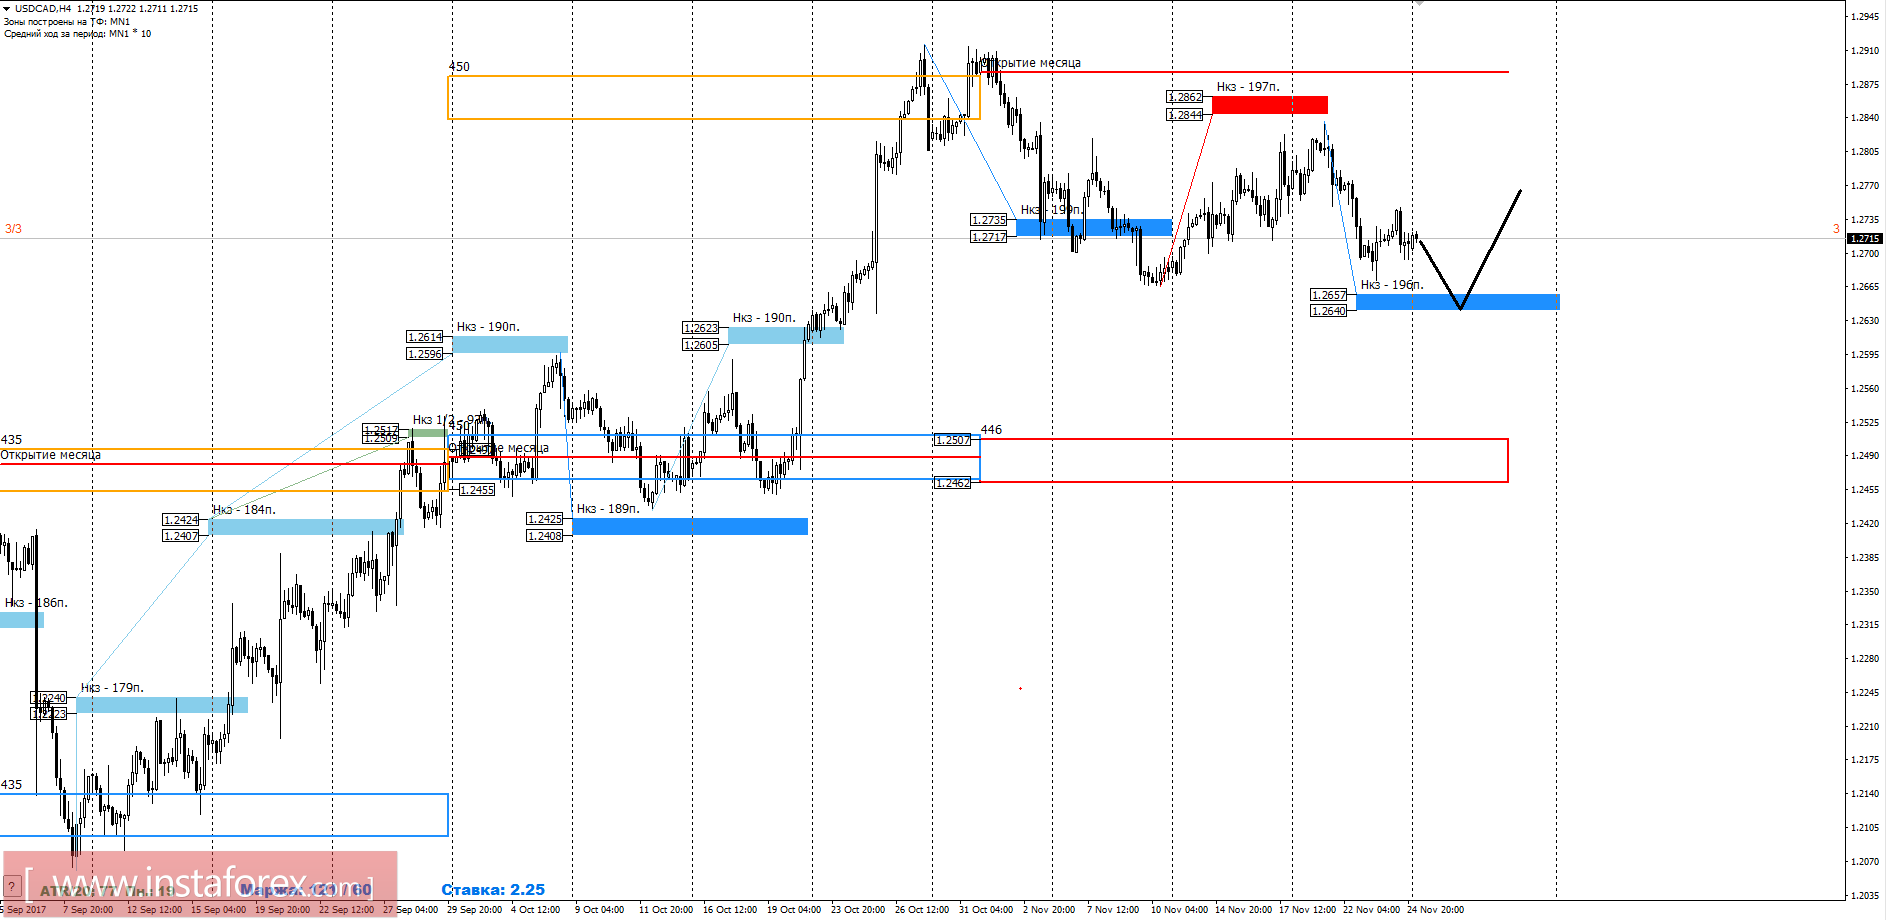
An alternative model will develop if the pair can maintain the fall from the previous week in current marks. This allows for the consideration of the trend in the flat range and beyond in the medium-term.
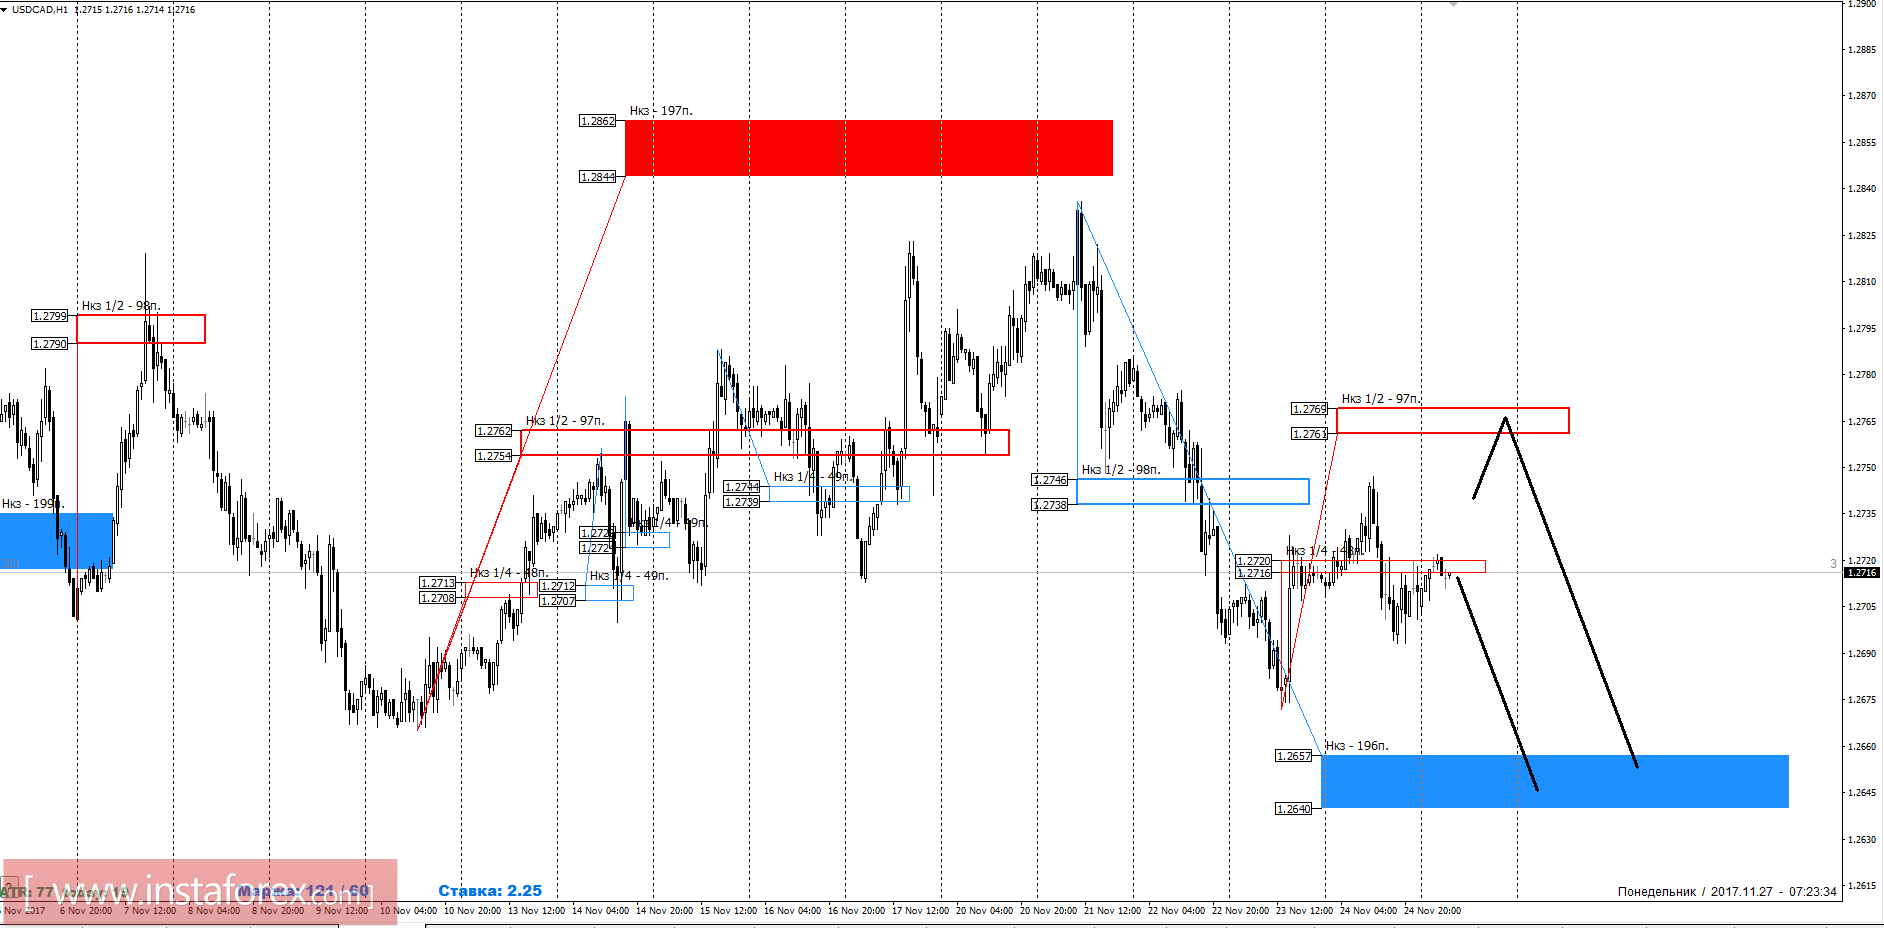
Intraday plan.
On Friday, the NKZ 1/4 1.2720-1.2716 was tested, which led to the formation of a downward momentum continuation model. It is worth remembering that after the consolidation below the NKZ 1/2 at 1.2746-1.2738, the main direction becomes a downtrend. Any upward movement that does not go beyond the framework of the NKZ 1/2 at 1.2769-1.2761 will be in the form of a correction. The test of the specified zone will allow the possibility to get the most favorable prices for the sale of the instrument. The purpose of the downward movement is the weekly short-term target of 1.2657-1.2640. Therefore, the risk-to-profit ratio must be calculated taking this into account.
The daytime CP is the daytime control zone. The zone formed by important data from the futures market that change several times a year.
The weekly CP is the weekly control zone. The zone is formed by marks from important futures market which change several times a year.
The monthly CP is the monthly control zone. The zone is a reflection of the average volatility over the past year.