 English
  Русский
 Bahasa Indonesia
 Bahasa Malay
 ไทย
ไทย Español
 Deutsch
 Български
 Français
 Tiếng Việt
 中文
中文 বাংলা
বাংলা हिन्दी
 Čeština
 Українська
 Română

GBP / JPY pair
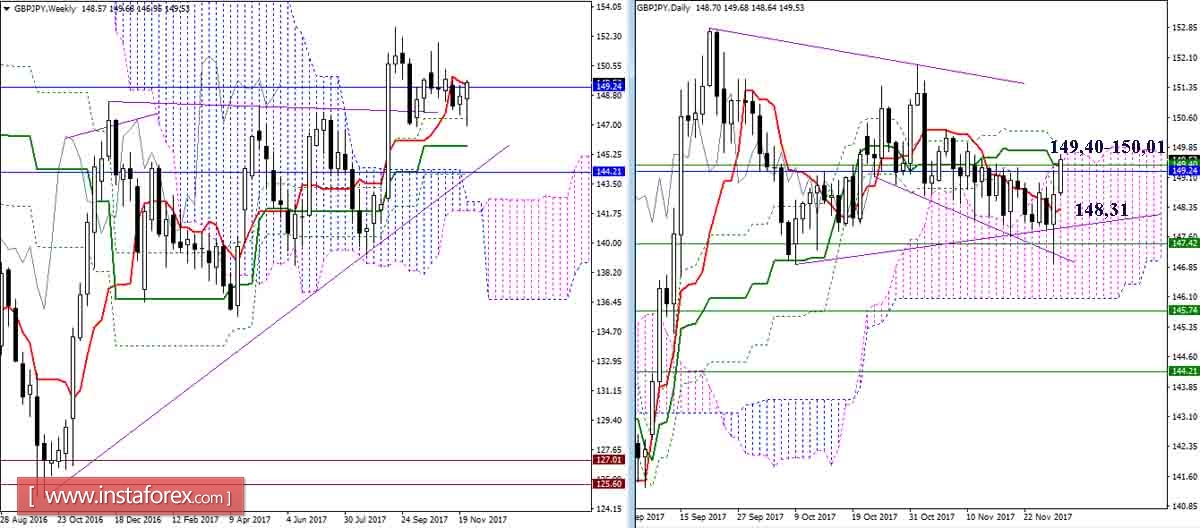
Yesterday, players on the fall updated the lows and tested the support level of 147.41 (weekly Fibo Kijun). Another decrease was received again by the bears in response to a fairly rapid and active counteraction of bulls. As a result, the players on the increase have already reached the most important resistance (weekday Tenkan 149.41 + daily Kijun 149.43 + daytime Senkou Span A 149.37 + daytime Fibo Kijun 150.01). Breakdown and consolidation of the above resistances will facilitate the exit from the consolidation zone and the emergence of new upward prospects.
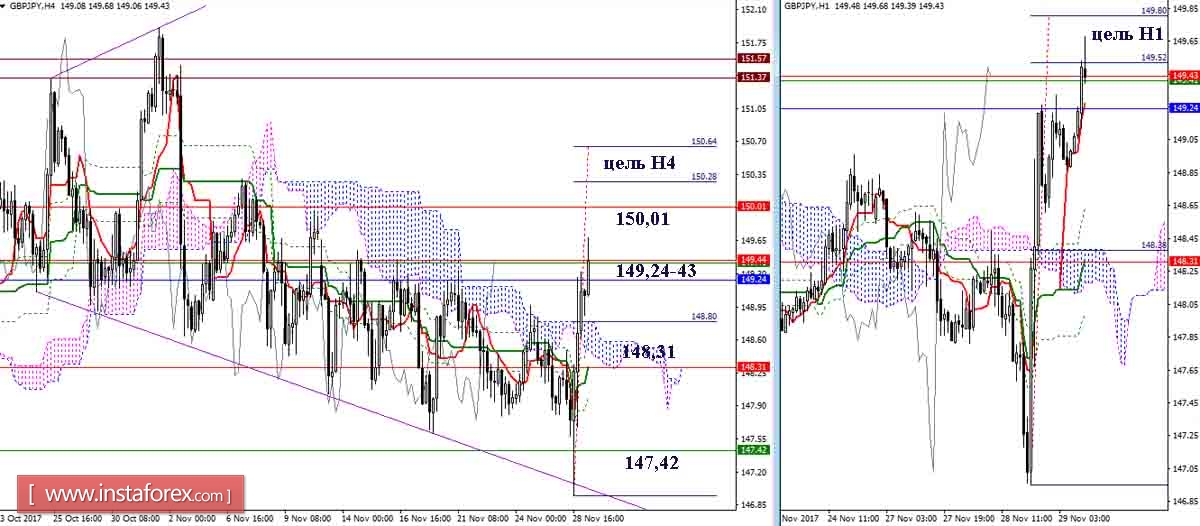
Players on the rise could finally overcome the H4 cloud and gain a foothold in the bull zone against the cloud. Thanks to the breakdown, an upside target, H1 cloud, having worked out to the present moment. The H4 and H1 could slow down the development of events or even complete another breakout of the players to increase. Hence, the main task of bulls is to overcome the resistance.
EUR / JPY pair
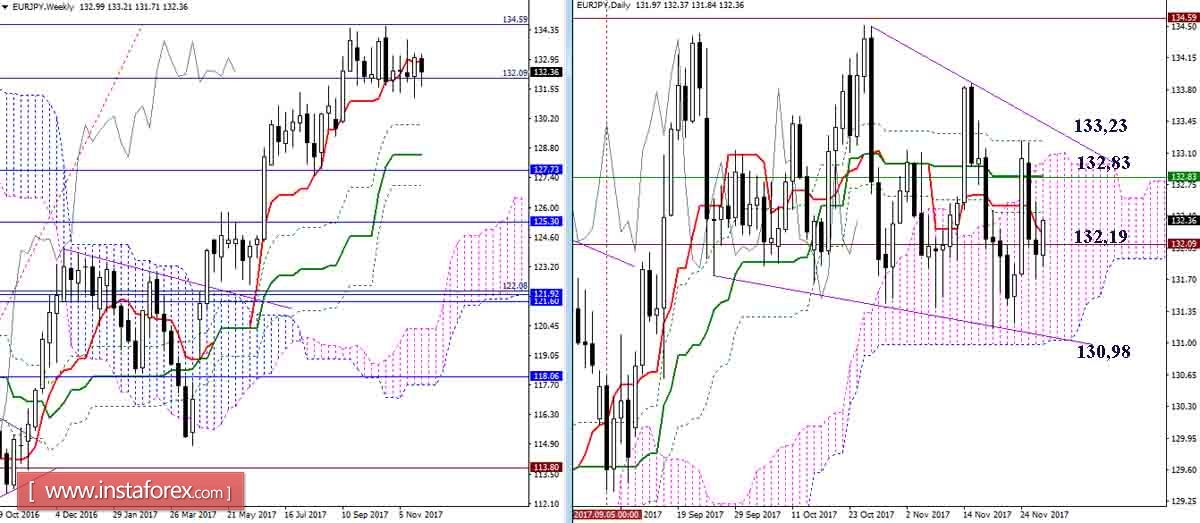
Players on the rise again attempted to keep the situation from completely declining. Working in the daytime cloud contributes to uncertainty and instability. For today, the most important resistance zone still remains 132.83 (daily Kijun + week Tenkan + daytime Senkou Span A) - 133.23 (daytime Fibo Kijun). As a result of overcoming which the situation may change and a new downward target will appear, the support is still the lower boundary of the daytime cloud (130.98).
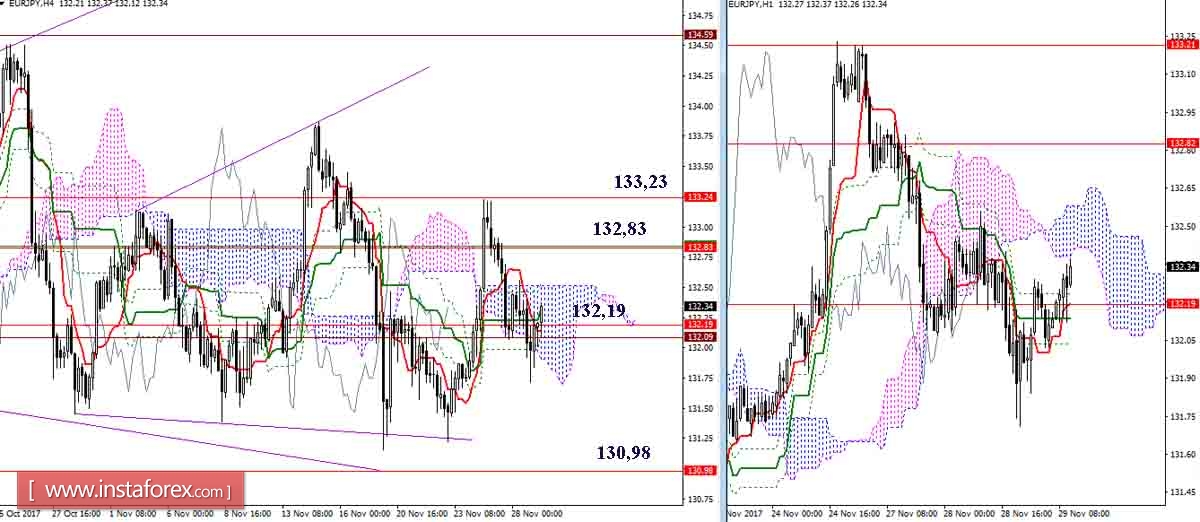
The pair returned to the H4 cloud after failing to overcome the resistance. Today, the daily short-term trend (132,19) changed its location and is now increasing the support and attraction of the H4 cloud. The goal of players is to increase the hold on the situation and return to the testing of resistances (132.83 - 133.23), with an expectation of overcoming them. Alternately, it will return to the side of the bulls for daily short-term trend and secure the bearish zone relative to the H4 cloud, will most likely trigger a new activity of the bears, while the support for 130.98 (Senkou Span B of the day's cloud) will remain the benchmark for the decline.
Indicator parameters:
all time intervals 9 - 26 - 52
The color of indicator lines:
Tenkan (short-term trend) - red,
Kijun (medium-term trend) - green,
Fibo Kijun is a green dotted line,
Chikou is gray,
clouds: Senkou Span B (SSB, long-term trend) - blue,
Senkou Span A (SSA) - pink.
The color of additional lines:
support and resistance MN - blue, W1 - green, D1 - red, H4 - pink, H1 - gray,
horizontal levels (not Ichimoku) - brown,
trend lines - purple.