 English
  Русский
 Bahasa Indonesia
 Bahasa Malay
 ไทย
ไทย Español
 Deutsch
 Български
 Français
 Tiếng Việt
 中文
中文 বাংলা
বাংলা हिन्दी
 Čeština
 Українська
 Română

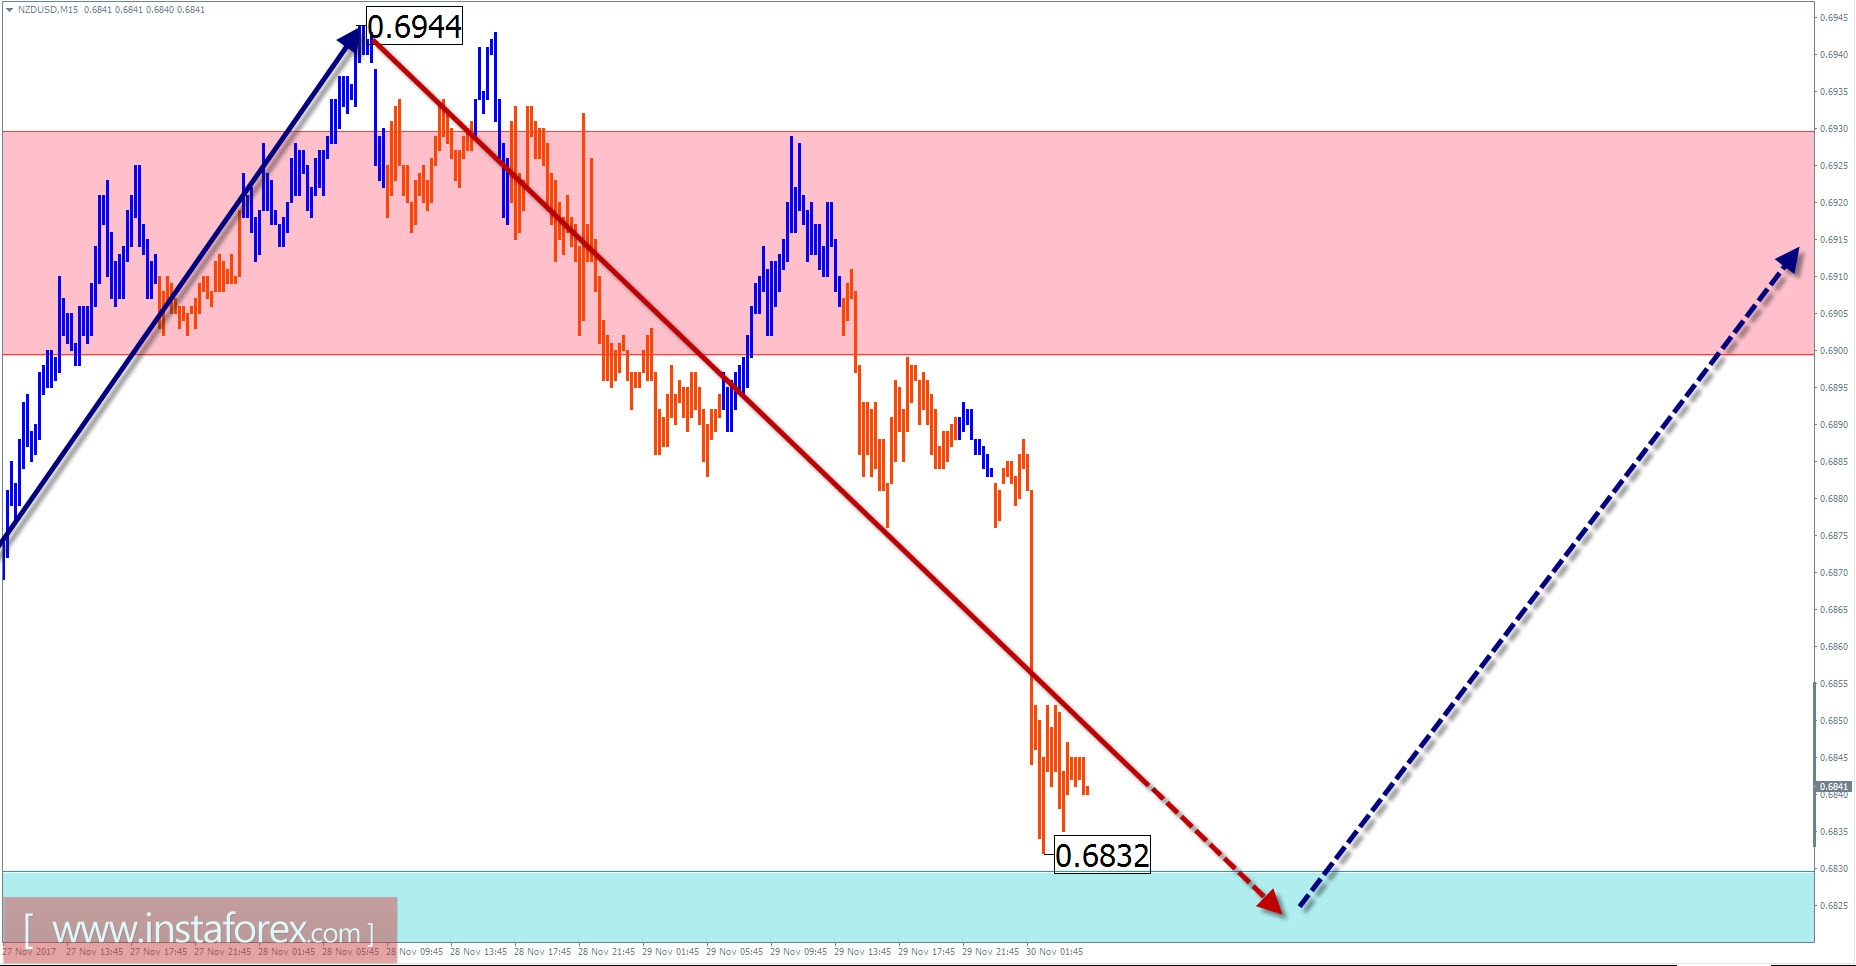
NZD / USD outlook for the current day
On the daily timeframe, the major currency New Zealand dollar shows a change in direction. The price of the pair reached the upper limit of the wide zone potential reversal due to the formation of the last descending wave from July 27. The bearish wave structure is formed. The preliminary target area is located within the control zone. There is a high probability of change in direction of the major price movement next week.
The wave level of the rising wave that started this month is not enough to change the trend. The formation of correction can be considered with a prospect of moving towards a large-scale movement.
Today, the reduction of quotations is expected to end. Breaking the lower boundary of the zone seems improbable. Then, the price is expected for a turn and the price will begin to rise.
Boundaries of resistance zones:
- 0.6900 / 0.6930
Boundaries of support zones:
- 0.6830 / 0.6800
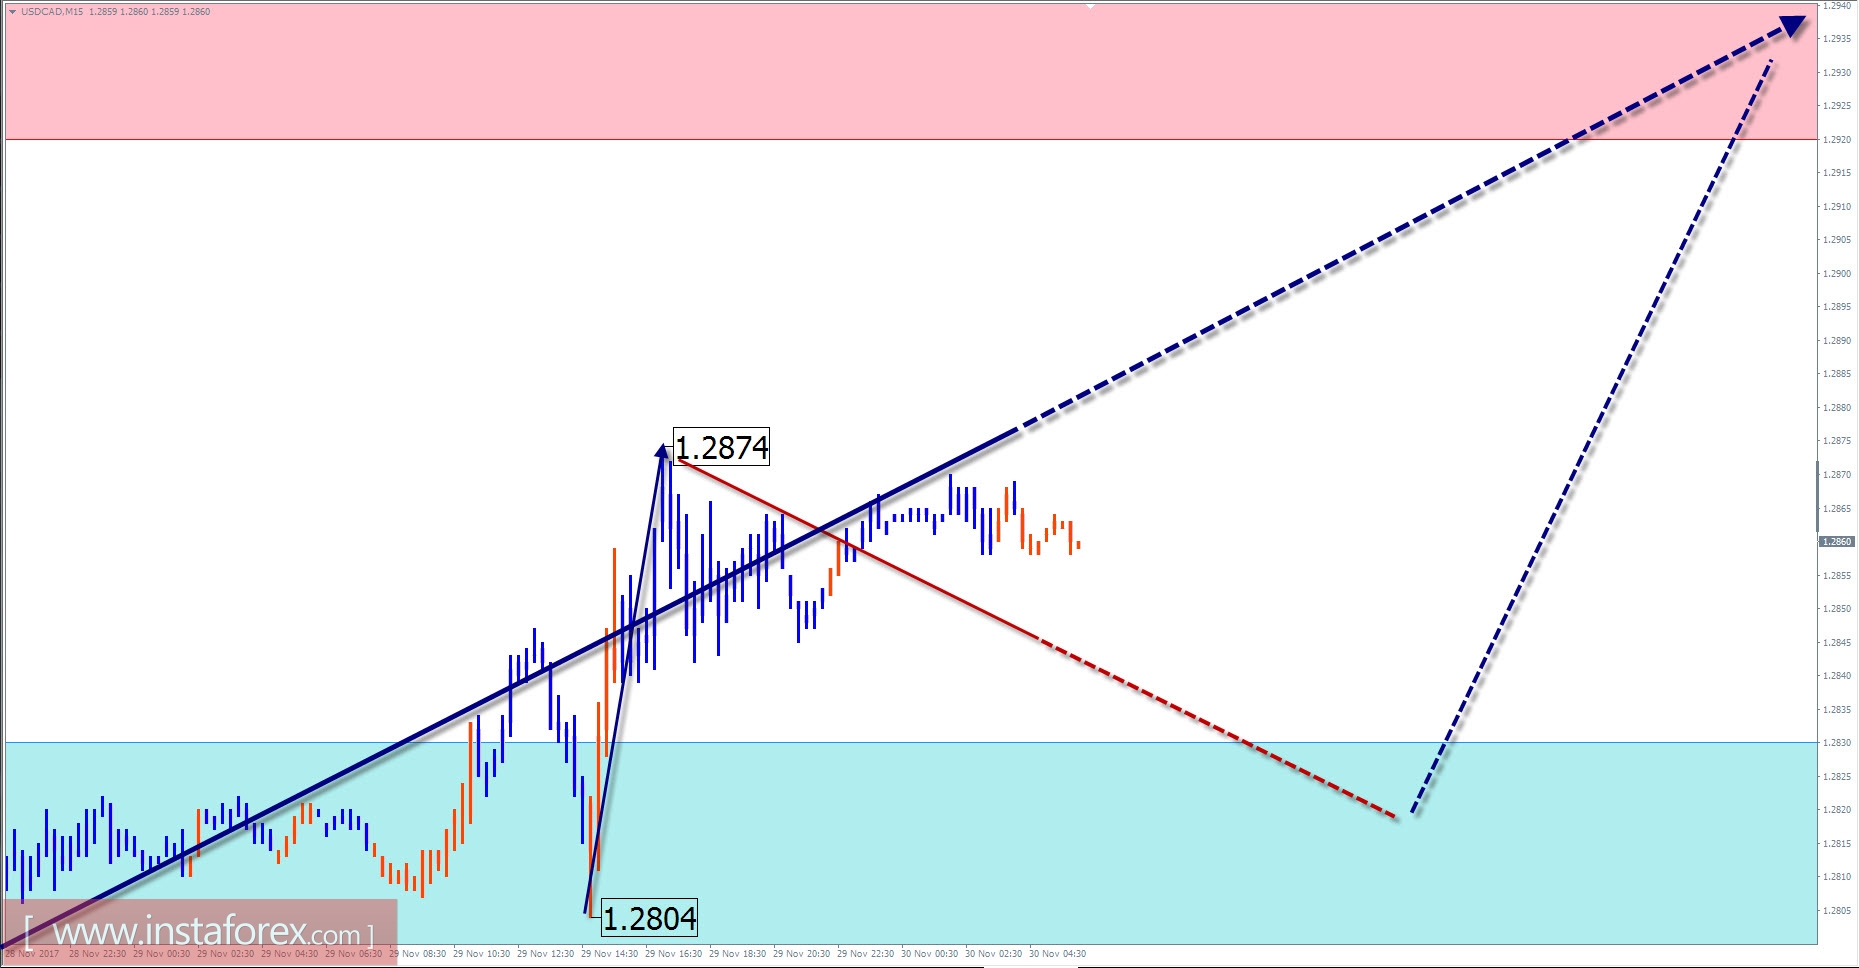
USD / CAD review with current day forecast
The direction of the short-term trend of the major pair Canadian currency since early September was set by the rising wave. Since October 27, a counterwave has started, but not yet complete. In its formation for the past two weeks, the development of the middle part of the structure started. Judging by its configuration, the target recovery level should update the local high of the current bearish wave.
Today, the general upward trend of price fluctuations is expected. During the European trading session, a short-term decline is possible that will occur not beyond the boundaries of the support zone. The active phase of the movement is expected in the afternoon. The upper limit of daily volatility limits the resistance zone.
Boundaries of resistance zones:
- 1.2920 / 50
Boundaries of support zones:
- 1.2830 / 1.2800
Explanations to the figures: For simplified wave analysis, a simple waveform is used that combines 3 parts (A; B; C). Of these waves, all kinds of correction are composed and most of the impulses. On each considered time frame the last and incomplete wave is analyzed.
The areas marked on the graphs are indicated by the calculation areas in which the probability of a change in the direction of motion is significantly increased. Arrows indicate the wave counting according to the technique used by the author. The solid background of the arrows indicates the structure formed, the dotted one indicates the expected wave motion.
Attention: The wave algorithm does not take into account the duration of the tool movements in time. The forecast is not a trading signal! To conduct a trade transaction, you need to confirm the signals of your trading systems.
* The presented market analysis is informative and does not constitute a guide to the transaction.