 English
  Русский
 Bahasa Indonesia
 Bahasa Malay
 ไทย
ไทย Español
 Deutsch
 Български
 Français
 Tiếng Việt
 中文
中文 বাংলা
বাংলা हिन्दी
 Čeština
 Українська
 Română

EURUSD continues its move lower as expected since it topped and reversed on November 9th. Price initially reached the 38% Fibonacci retracement but as we explained in our analysis, a move towards the 61.8% was highly probable.
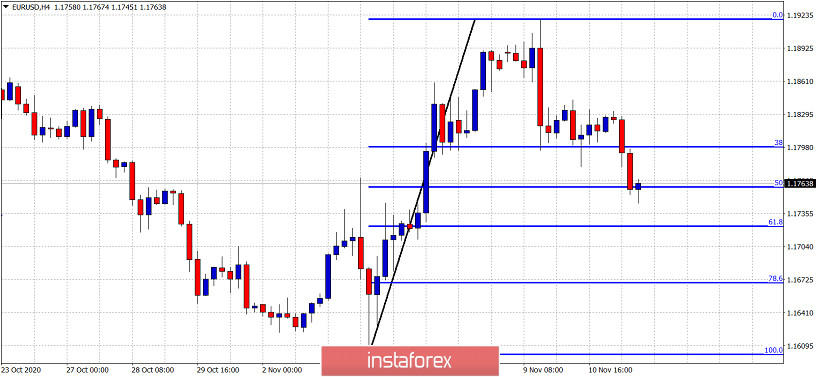
EURUSD has so far reached the 50% retracement. Price is making lower lows and lower highs. Bulls need to see the formation of a higher low and to get more fuel in order to start next leg higher. Bulls need to defend the 61.8% level and break above 1.1840 short-term resistance. Bears on the other hand need to push price even lower towards and below 1.16 in order to hope for a bigger correction. Our preferred strategy as we explained in previous analysis is to wait for the formation of a higher low around the 61.8% Fibonacci retracement. Once we get a reversal signal we look to buy with the 1.16 level as stop.