 English
  Русский
 Bahasa Indonesia
 Bahasa Malay
 ไทย
ไทย Español
 Deutsch
 Български
 Français
 Tiếng Việt
 中文
中文 বাংলা
বাংলা हिन्दी
 Čeština
 Українська
 Română

Last week, the monthly control zone (KZ) of November at 1.3528-1.3479 was already reached. This stopped the medium-term growth of the pair. The current downward movement is corrective, and its first target is to return to the weekly control zone (NKZ) 1.3390-1.3358.
Medium-term plan.
The monthly KZ test of November at 1.3528-1.3479 caused a constant decline, which considers correctional sales of the instrument. The maximum zone of correction is the weekly KZ at 1.3229-1.3197. The nearest support remains the weekly KZ at 1.3390-1.3358. If the pair can stay above this zone, the upward movement will continue and the local maximum of December will be updated. At the beginning of this week, the task is to get more favorable prices for the purchase of instruments. Hence, the reduction to either one of the control zones should be considered for the emergence of demand.
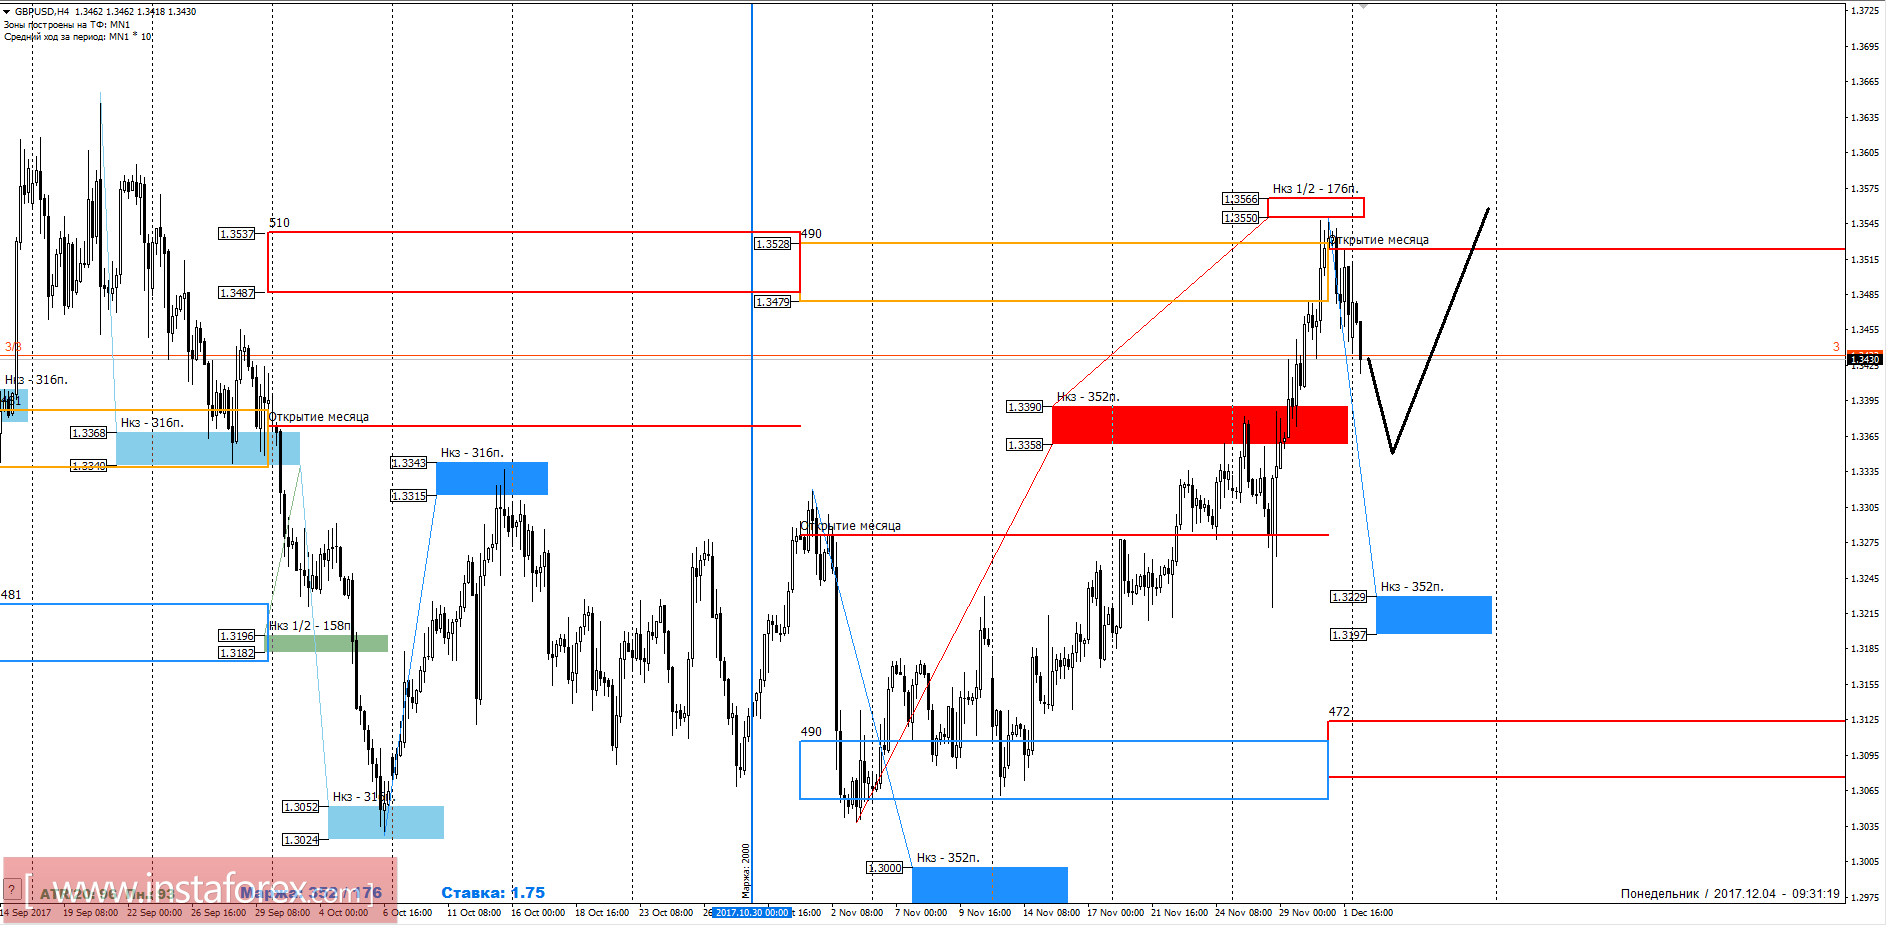
For the formation of an alternative model, the fall of the Asian exchange rate and the consolidation above the opening point of trading is necessary. This will enable to consider the continuation of growth from current levels.
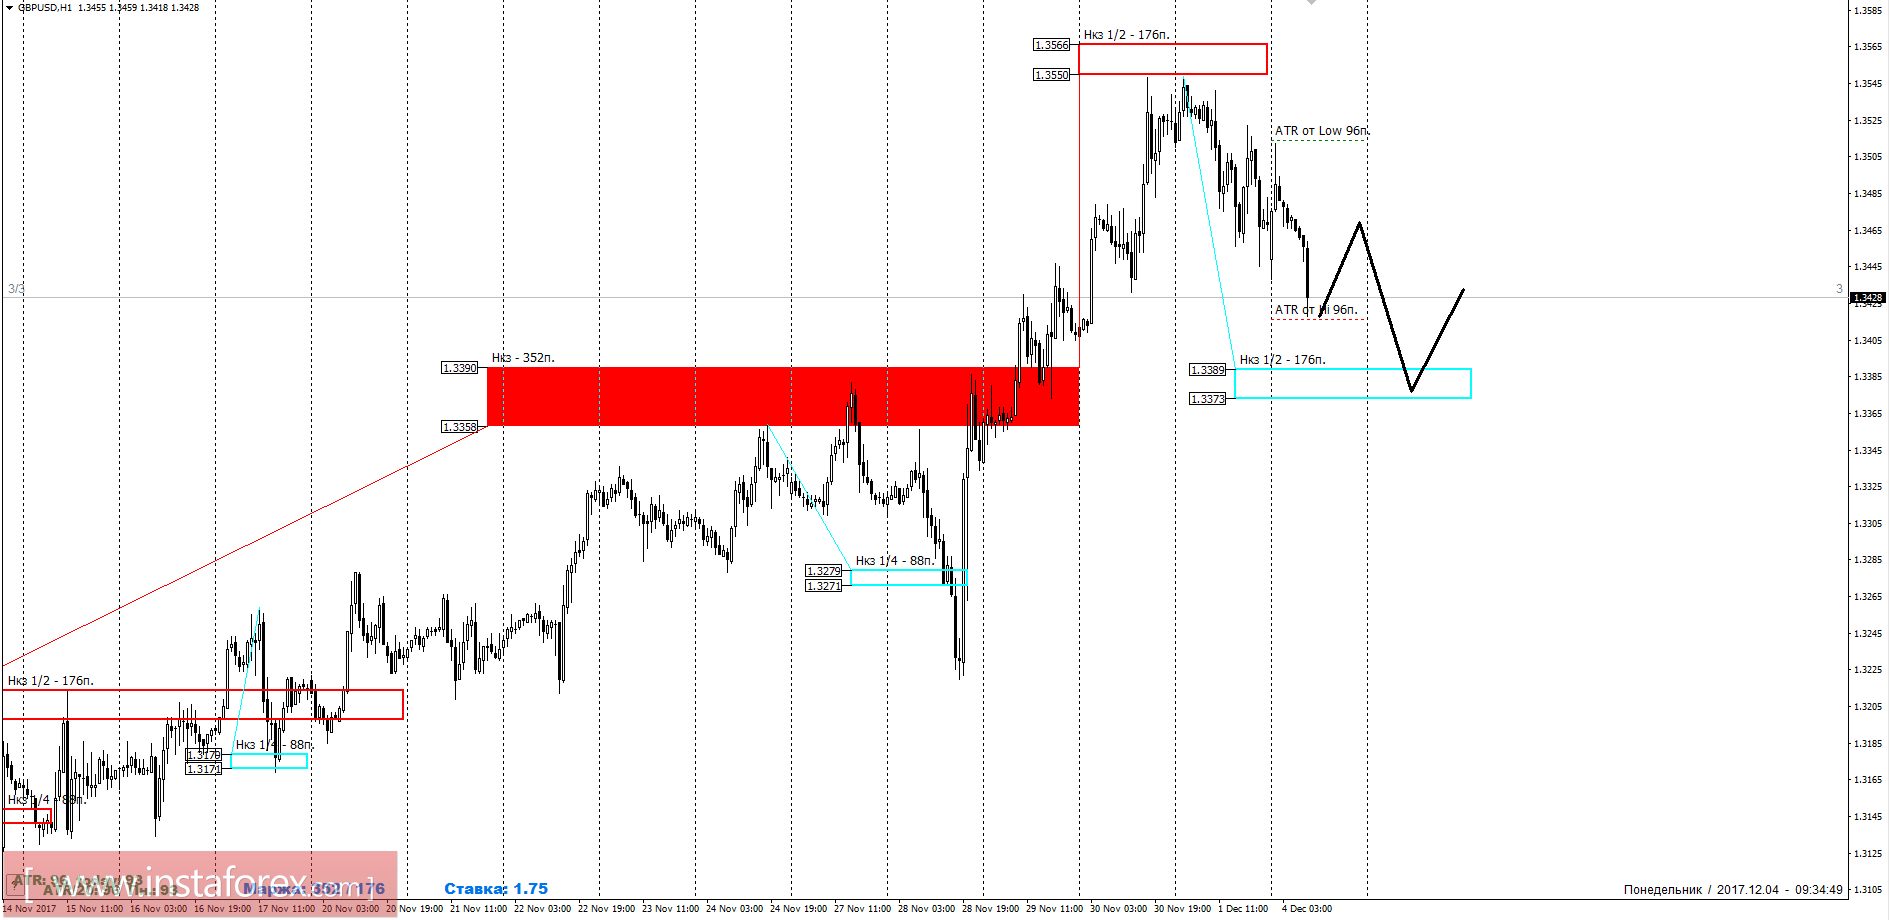
Intraday plan.
As the week begins, the nearest support can be found at the NKZ 1/2 1.3389-1.3373. While the pair is trading above this zone, the upward movement will remain impulsive which will allow further observation in the future update of the December highs. The most profitable purchase prices are within the specified zone. It is important to understand that the zone is outside the average daily course, which may take several days to implement the model.
Daytime CP is the daytime control zone. The zone formed by important data from the futures market, which change several times a year.
Weekly CP is the weekly control zone. The zone formed by important futures market marks, which change several times a year.
Monthly CP is the monthly control zone. The zone is a reflection of the average volatility over the past year.
* The presented market analysis is informative and does not constitute a guide to the transaction.