 English
  Русский
 Bahasa Indonesia
 Bahasa Malay
 ไทย
ไทย Español
 Deutsch
 Български
 Français
 Tiếng Việt
 中文
中文 বাংলা
বাংলা हिन्दी
 Čeština
 Українська
 Română

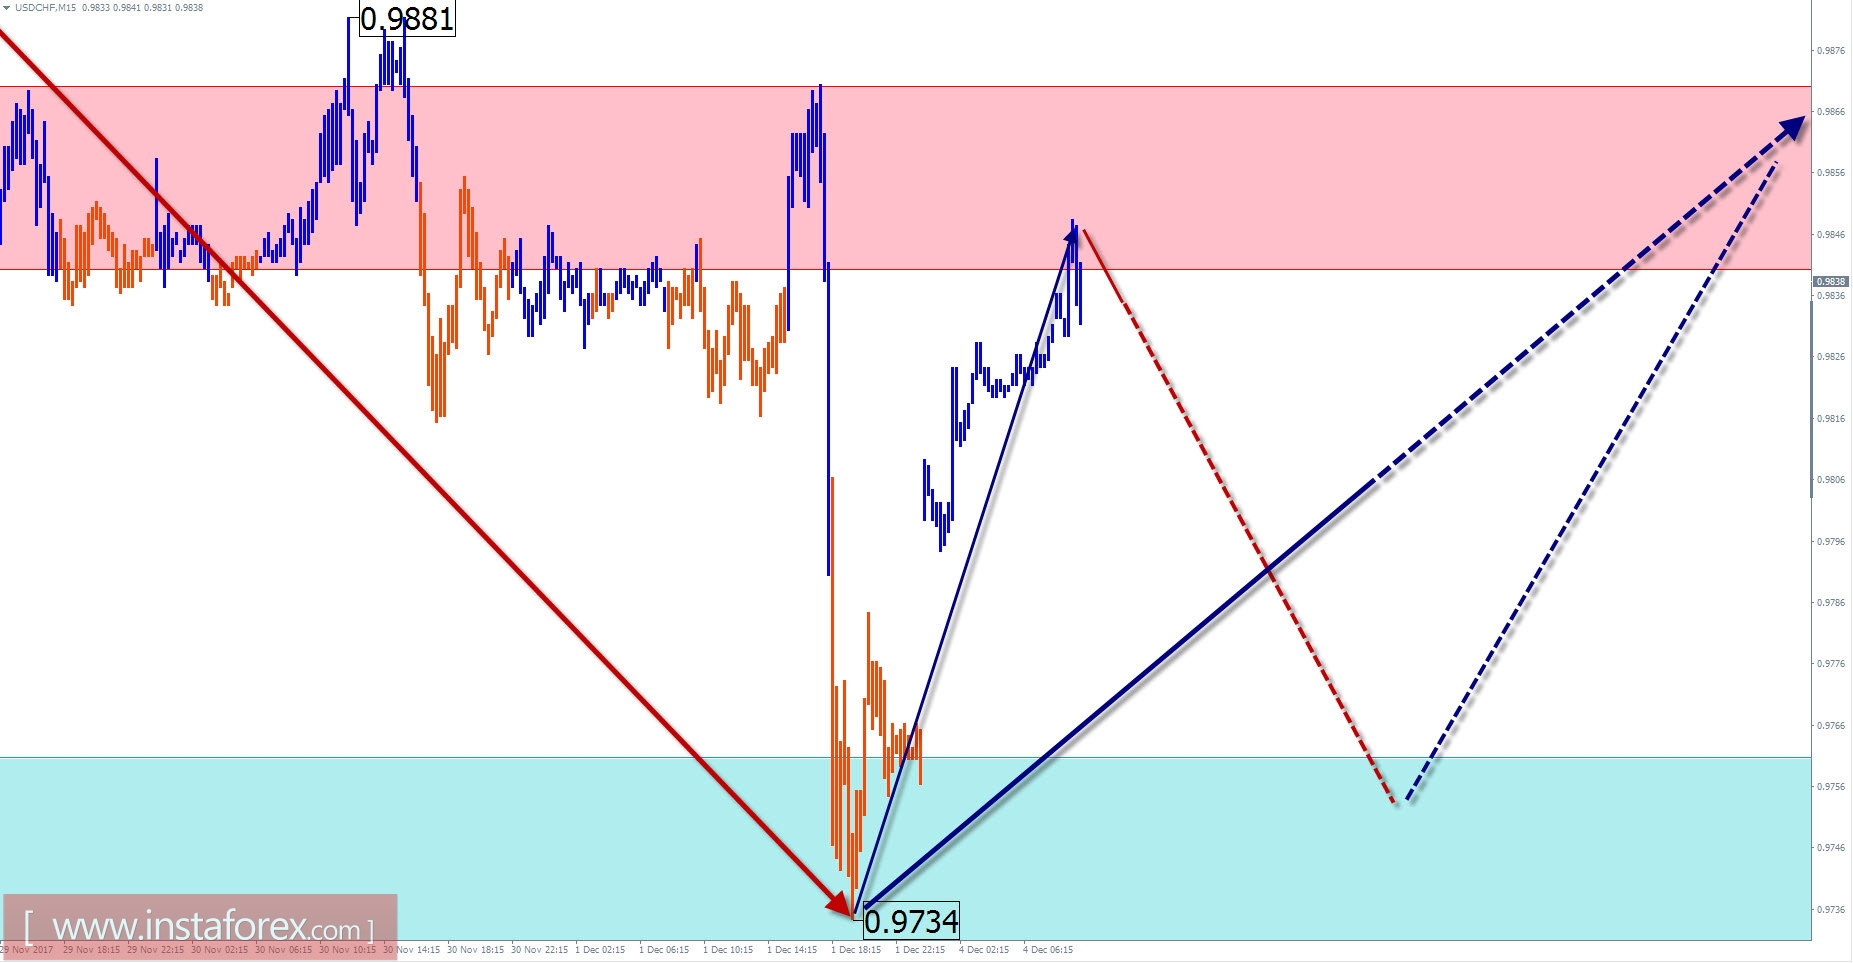
USD / CHF review with current day forecast
As indicated in the short-term trend chart, the direction of the major pair Swiss franc and USD is set by an upward wave which was indicated on August 29. Since October 27, the descending phase of the wave has moved. As the present day begins, the price reached the estimated target completion zone, with the wave structure fully formed. As the last trading day begins, the ascending segment has a high wave level exceeding the size of the pullback. Based on indications, an inter-trend reversal is expected in the next few days.
At the current trading session, the price is expected to be in a flat tone of the movement which could possibly have descending trend. Its lower boundary is the support zone. A return to the upward price movement is expected at the end of this day or tomorrow.
Boundaries of resistance zones:
- 0.9840 / 70
Boundaries of support zones:
- 0.9760 / 30
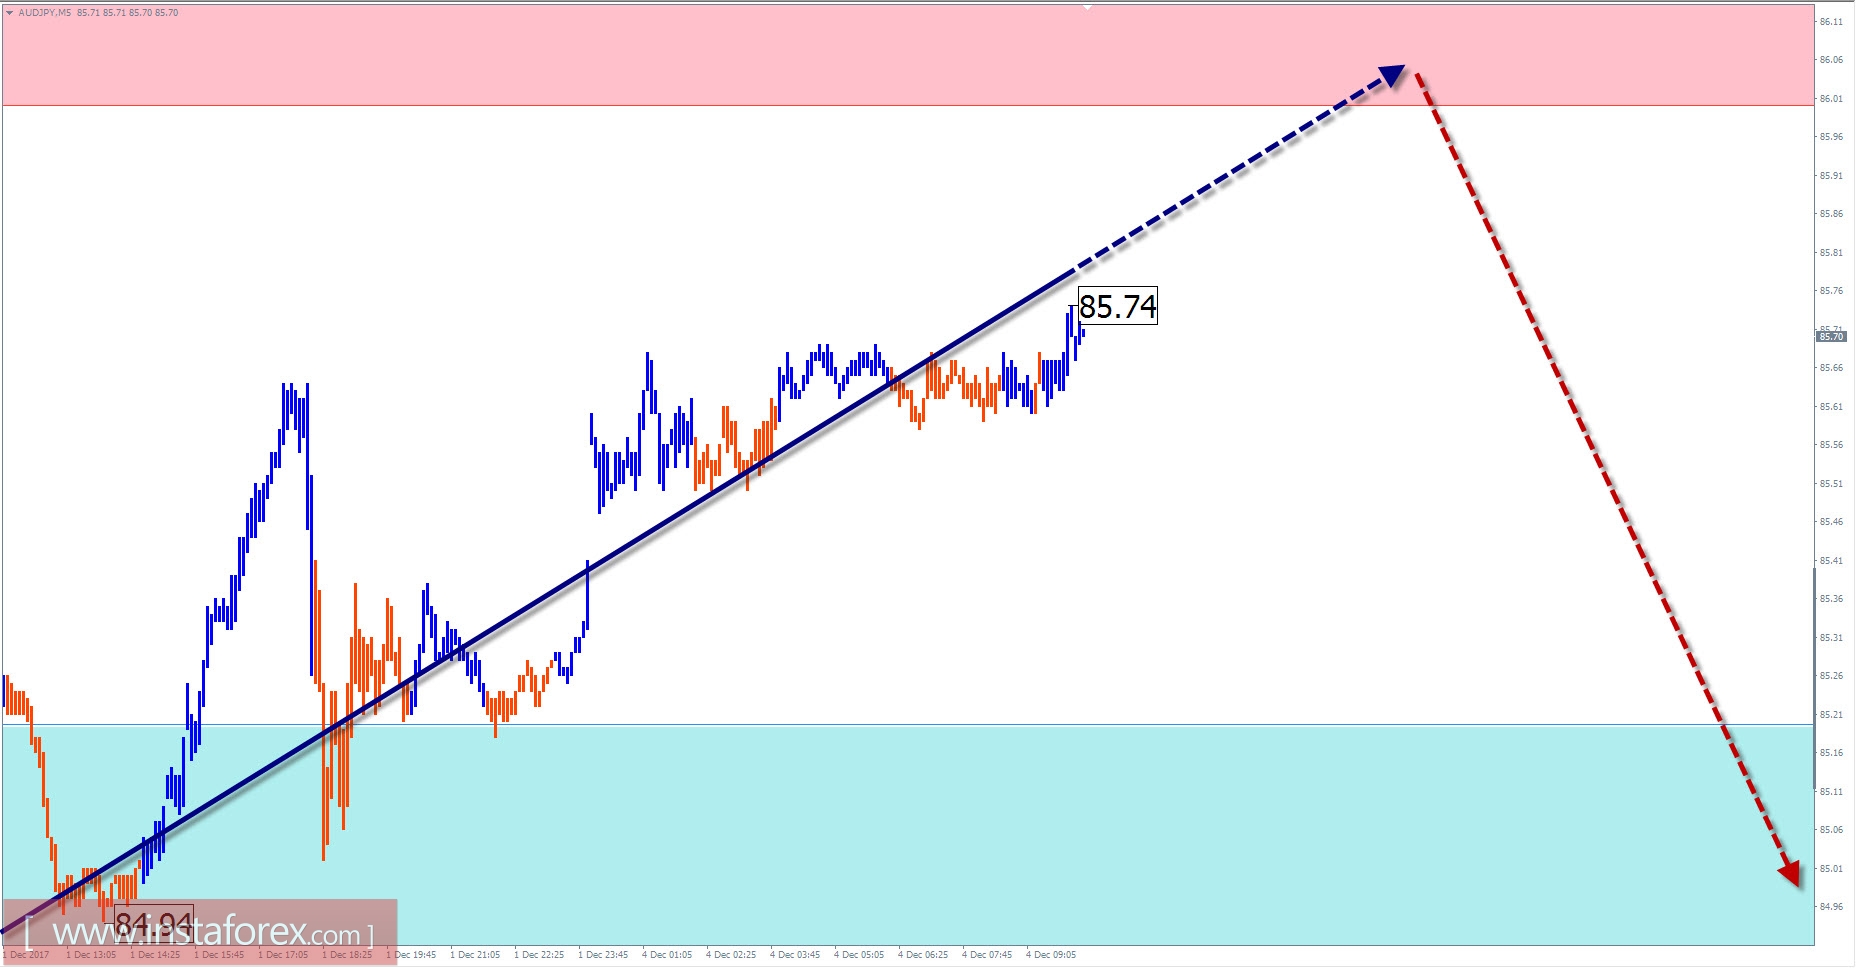
Overview of AUD / JPY with the forecast for the current day
On the daily scale of the cross-pair chart, the major trend of the price movement is set by an upward wave, which started in June last year. Having reached the lower boundary of the strong resistance zone by July, the price began to form a counter correction.
The last unfinished wave for today, creating a short-term price movement trend, is considered a downward segment from September 21. After the active phase of decline since in the middle of November, the conditions for an upcoming pullback were created.
Over the next day, the completion of an upward mood of the trend in the past days is expected. From the boundaries of the estimated resistance zone, further reversal and the beginning of the downward price trend are expected. Closer to the end of the day, a sharp increase in the volatility of the pair is possible.
Boundaries of resistance zones:
- 86.00 / 86.30
Boundaries of support zones:
- 85.20 / 84.90
Explanations to the figures: For simplified wave analysis, a simple waveform is used that combines 3 parts (A; B; C). Of these waves, all kinds of correction are composed and most of the impulses. On each considered time frame the last and incomplete wave is analyzed.
The areas marked on the graphs are indicated by the calculation areas in which the probability of a change in the direction of motion is significantly increased. Arrows indicate the wave counting according to the technique used by the author. The solid background of the arrows indicates the structure formed, the dotted one indicates the expected wave motion.
Attention: The wave algorithm does not take into account the duration of the tool movements in time. The forecast is not a trading signal! To conduct a trade transaction, you need to confirm the signals of your trading systems.