 English
  Русский
 Bahasa Indonesia
 Bahasa Malay
 ไทย
ไทย Español
 Deutsch
 Български
 Français
 Tiếng Việt
 中文
中文 বাংলা
বাংলা हिन्दी
 Čeština
 Українська
 Română

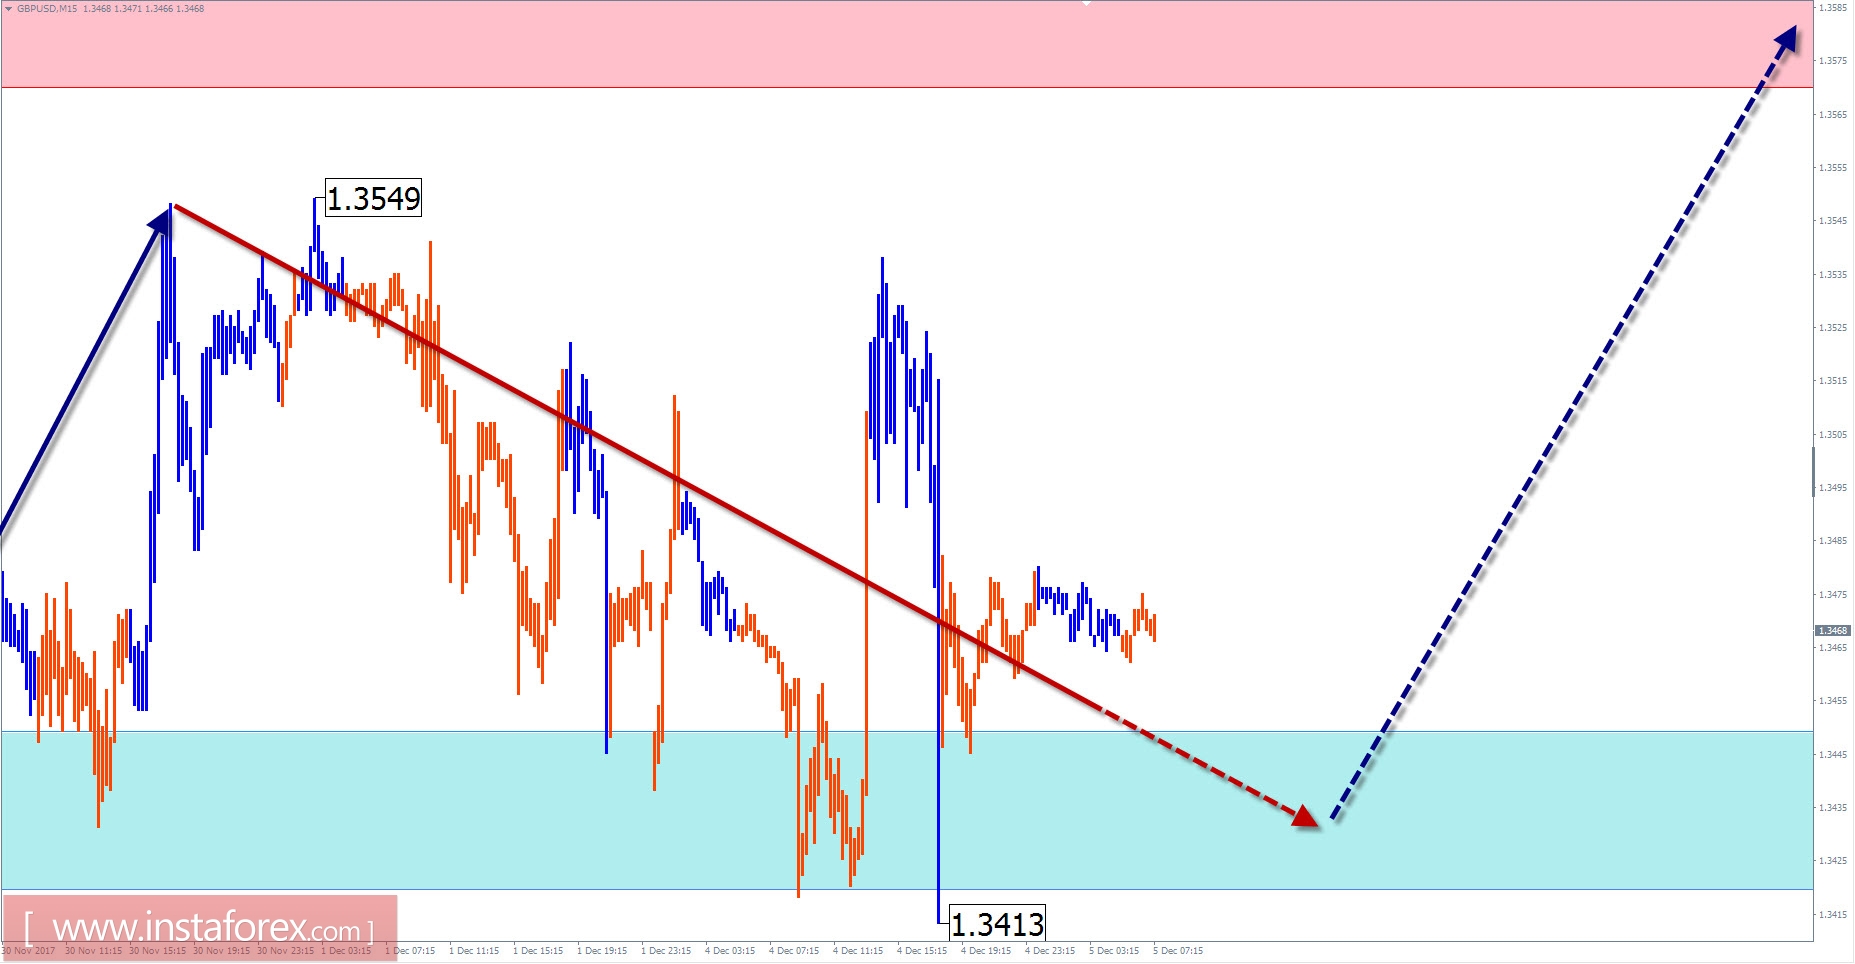
GBP / USD outlook for the current day
The price direction of the major English currency in the short-term timeframe is set by the current wave formation on September 19. This bearish wave lies at the end of the uptrend, near the lower boundary of the potential reversal zone.
Over the past month, the price has formed the middle part of the model (B), which entered the final phase. An incomplete zigzag was formed at the time of analysis at the end of November 28. While, the price is rolling back down from the resistance level since last Friday.
Today, the completion of the downward rollback is expected. In the afternoon, a reversal is expected within the support zone and the pair's quotations begin to grow. A breakthrough of the upper boundary of the resistance zone is highly expected in the following days.
Boundaries of resistance zones:
- 1.3570 / 1.3600
Boundaries of support zones:
- 1.3450 / 20
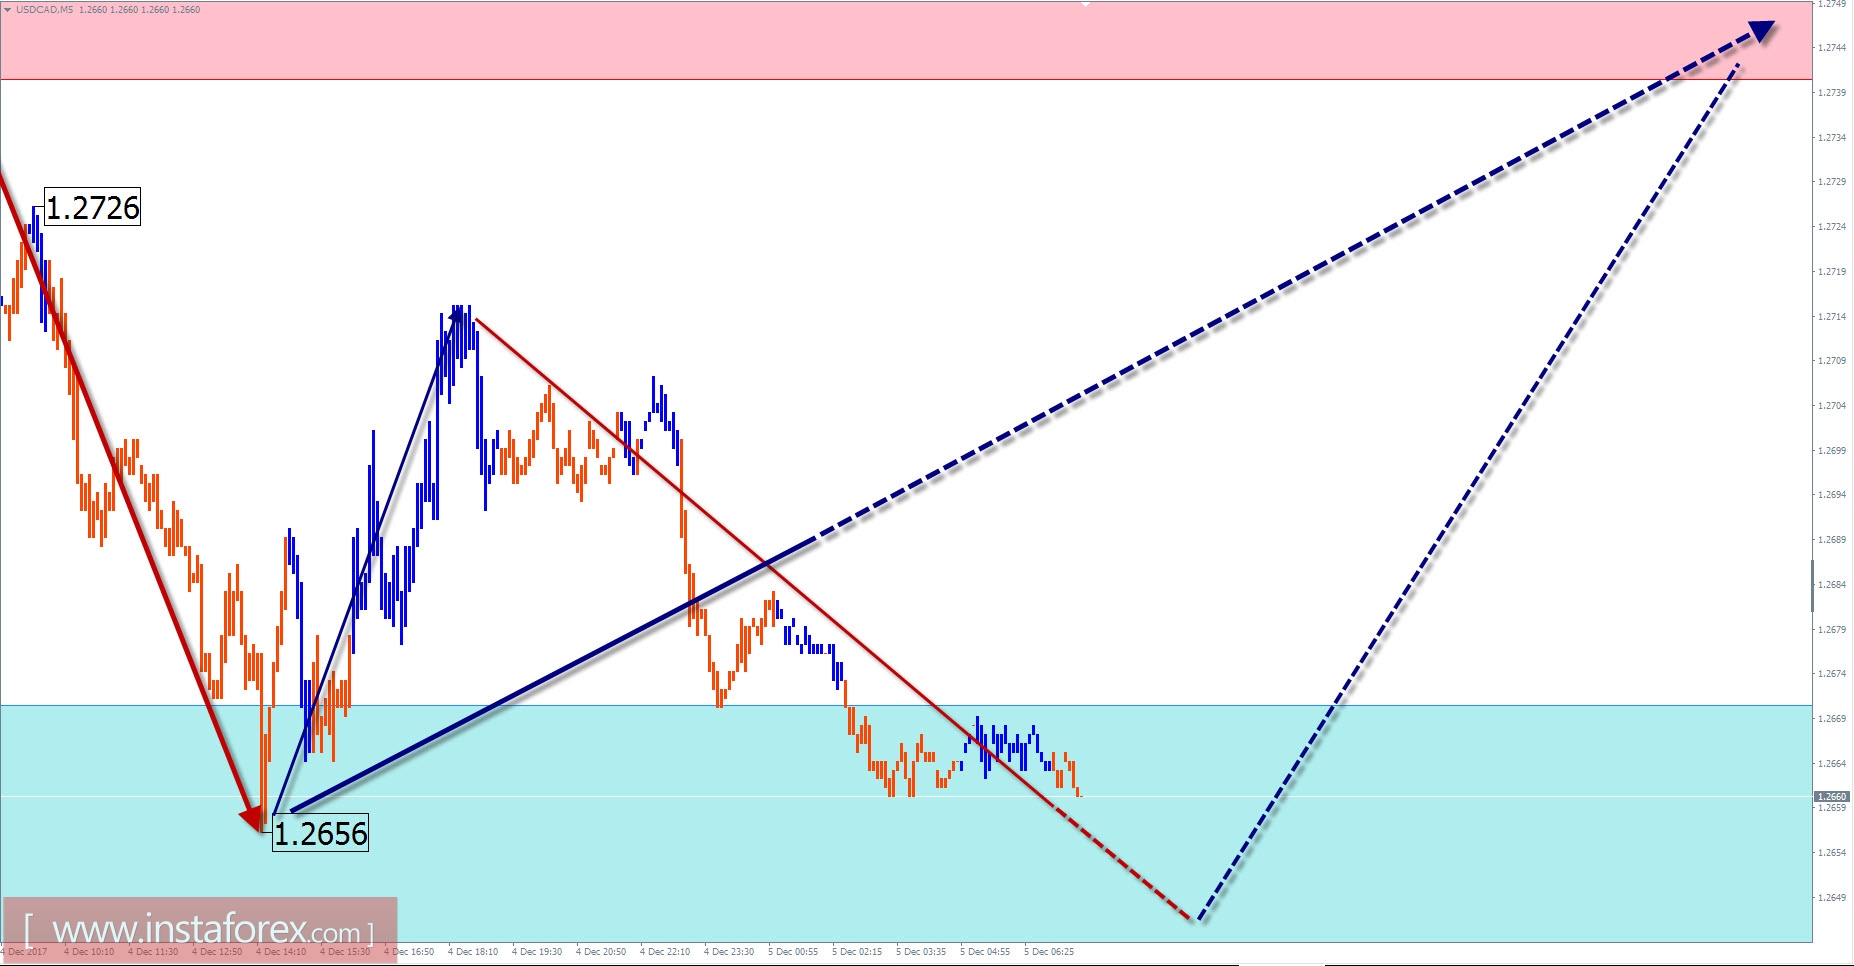
USD / CAD review with current day forecast
As shown on the daily scale chart of the major pair USD and Canadian dollar since January last year, a downward wave zigzag is tracked. As part of his last section (C), an upward rollback formed since the beginning of September. All throughout November at the flat entry point, the price formed a standard flat. At the time of analysis, the structure of this wave was fully formed. To complete the current phase of flow and start the next phase of the rising wave, it is necessary to wait for the completion of the small-scale reversal construction.
In the nearest trading session, fluctuations in the pair's price are expected, with a descending trend. A short-term gap on the lower boundary of the support zone is not ruled out but seems not feasible. Toward the end of the day, there will be a sharp increase in the possible change in direction of the movement and raise the instrument's direction.
Boundaries of resistance zones:
- 1.2740 / 70
Boundaries of support zones:
- 1.2650 / 20
Explanations to the figures: For simplified wave analysis, a simple waveform is used that combines 3 parts (A; B; C). Of these waves, all kinds of correction are composed and most of the impulses. On each considered time frame the last and incomplete wave is analyzed.
The areas marked on the graphs are indicated by the calculation areas in which the probability of a change in the direction of motion is significantly increased. Arrows indicate the wave counting according to the technique used by the author. The solid background of the arrows indicates the structure formed, the dotted one indicates the expected wave motion.
Attention: The wave algorithm does not take into account the duration of the tool movements in time. The forecast is not a trading signal! To conduct a trade transaction, you need to confirm the signals of your trading systems.
* The presented market analysis is informative and does not constitute a guide to the transaction.