 English
  Русский
 Bahasa Indonesia
 Bahasa Malay
 ไทย
ไทย Español
 Deutsch
 Български
 Français
 Tiếng Việt
 中文
中文 বাংলা
বাংলা हिन्दी
 Čeština
 Українська
 Română

EURUSD revisited the 1.1890 high that was tested twice this week and is now pulling back down. We need to remember that from 1.19 area last week price made a sharp reversal lower towards 1.1750 and another reversal in October towards 1.16. So the 1.19 level is very important resistance confirmed several times.
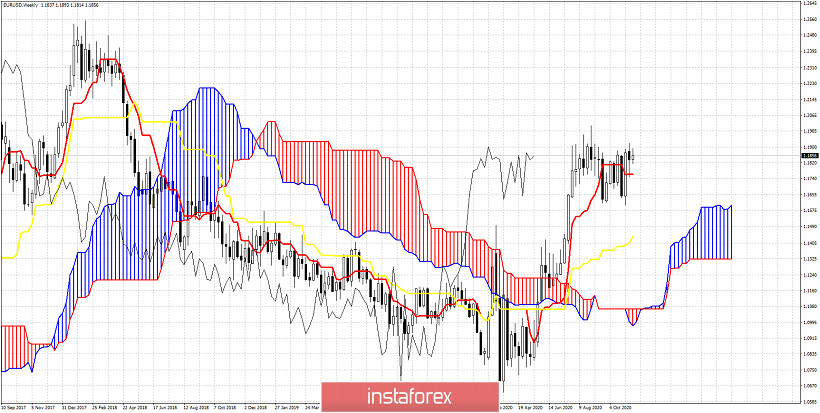
Short-term support as we explained in previous posts is at 1.18. A break below 1.18 would be a sign of weakness. Until then, bulls remain in control of the trend.