 English
  Русский
 Bahasa Indonesia
 Bahasa Malay
 ไทย
ไทย Español
 Deutsch
 Български
 Français
 Tiếng Việt
 中文
中文 বাংলা
বাংলা हिन्दी
 Čeština
 Українська
 Română

Gold has finally broken below $1,850 support level at the start of this week. We are not surprised by this price action as we believed this would be the most probable outcome. Gold price continued to trade below the Ichimoku cloud and this made us continue to expect the break down towards $1,800.
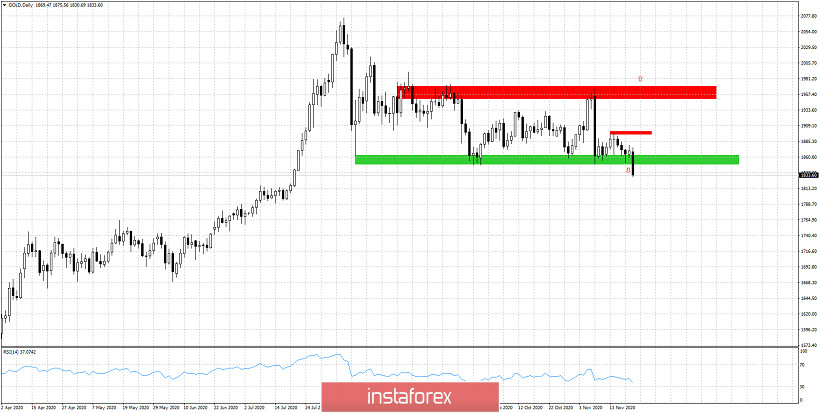
Green rectangle -support (broken)
Red rectangle- resistance levels
Gold price has finally broken a key support level. We now see Gold trading at $1,838 and we expect this downward move to continue lower towards $1,800 and maybe towards $1,750. Trend remains bearish as long as price is below $1,900.
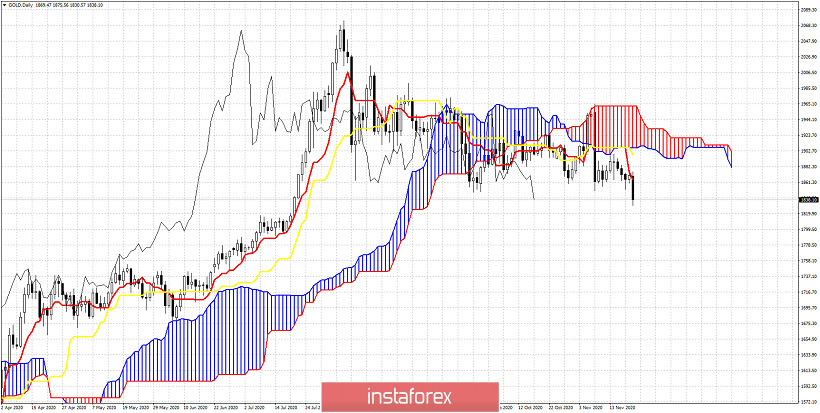
With Gold price still below the Daily Kumo (cloud) there was only one way for price to go. Resistance is at $1,865 by the tenkan-sen (Red line indicator). Bulls need to see a close above this level in order to hope for a move towards $1,900. All indicators in the Daily chart confirm bearish trend and rejection at $1,900. Gold price is expected to be under pressure at least this week.