EURUSD so far despite the volatility and the ups and downs, has held above the Ichimoku cloud in the 4 hour chart keeping short-term trend bullish. In our previous analysis we noted that a pull back towards 1.18 was possible and that bears needed to break below 1.18-1.1750 in order for short-term trend to change to bearish.
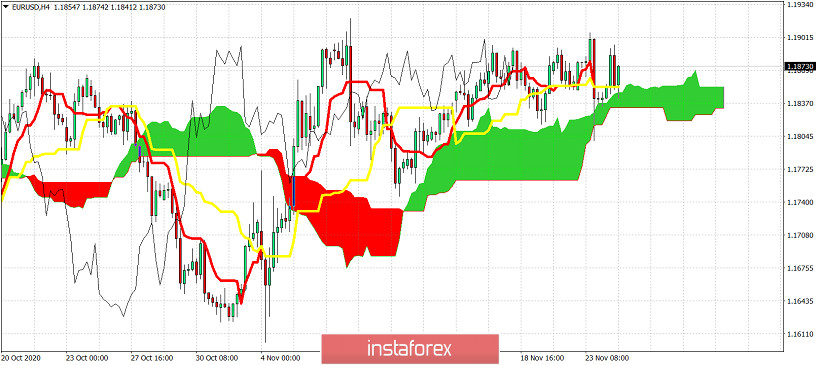
EURUSD price is above both the tenkan-sen (red line indicator) and the kijun-sen (yellow line indicator) and of course above the Kumo (cloud). Support is found at recent lows around 1.1840-1.1820. Bulls so far have defended the cloud support and are pushing price higher. This is a bullish sign. Bears need to break at least below the 4 hour Kumo in order to hope for a short-term trend change.
*The market analysis posted here is meant to increase your awareness, but not to give instructions to make a trade
 English
  Русский
 Bahasa Indonesia
 Bahasa Malay
 ไทย
ไทย Español
 Deutsch
 Български
 Français
 Tiếng Việt
 中文
中文 বাংলা
বাংলা हिन्दी
 Čeština
 Українська
 Română
