 English
  Русский
 Bahasa Indonesia
 Bahasa Malay
 ไทย
ไทย Español
 Deutsch
 Български
 Français
 Tiếng Việt
 中文
中文 বাংলা
বাংলা हिन्दी
 Čeština
 Українська
 Română

Prior -0.3%
- Market index 863.6 vs 831.5 prior
- Purchase index 314.6 vs 303.9 prior
- Refinancing index 4,077.7 vs 3,901.6 prior
- 30-year mortgage rate 2.92% vs 2.99% prior
The long-term mortgage rate fell to a survey low in the past week and that is continuing to spur housing market activity, with purchases and refinancing both jumping. After a bit of a slow period in mid-September to October, we're starting to see more of a pickup again.
Further Development
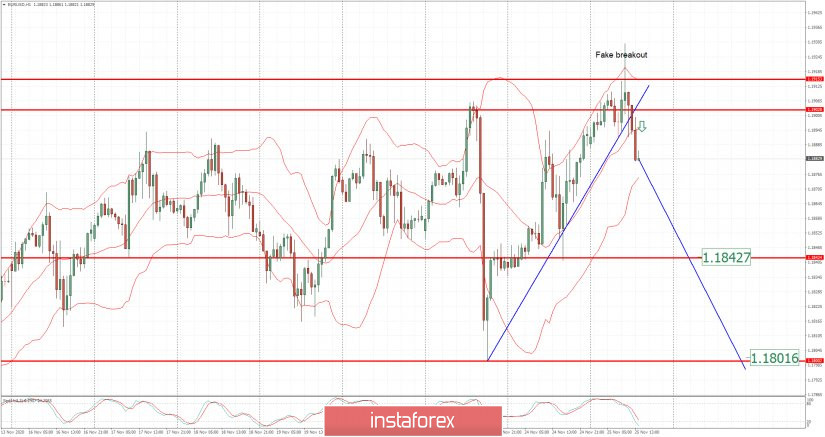
Analyzing the current trading chart fo EUR/USD, I found that there is fake breakout of the breakout of the balance high at 1,1915, which is sign that we might see downside movement.
1-Day relative strength performance Finviz
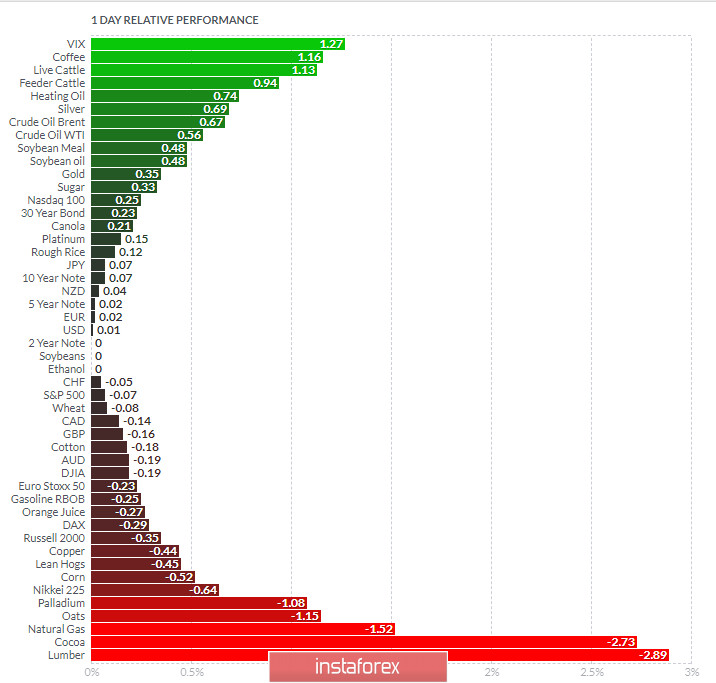
Based on the graph above I found that on the top of the list we got VIX and Coffee today and on the bottom Lumber and Cocoa.
EUR looks neutral on the list but with the fake of multi day high in the background, which is good sign of weakness.
Key Levels:
Resistance: 1,1,915/30
Support levels: 1,1842 and 1,1800.