 English
  Русский
 Bahasa Indonesia
 Bahasa Malay
 ไทย
ไทย Español
 Deutsch
 Български
 Français
 Tiếng Việt
 中文
中文 বাংলা
বাংলা हिन्दी
 Čeština
 Українська
 Română

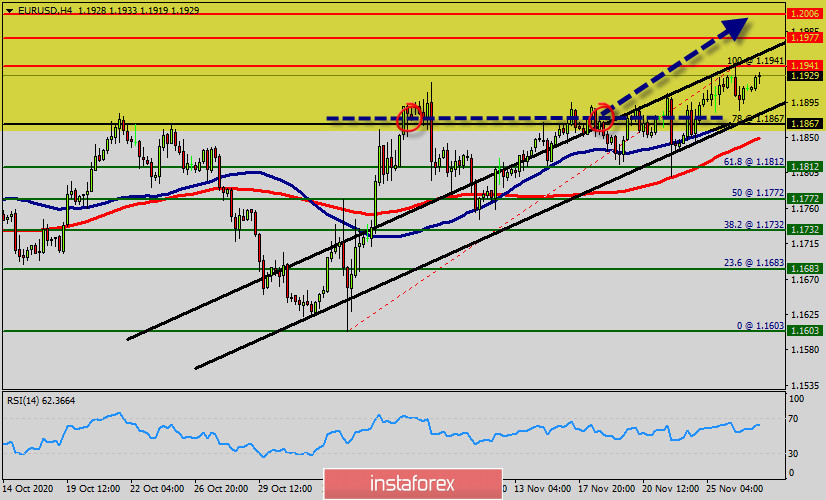
The EUR/USD pair is in uptrend without any reversal patterns because there is nothing new in this market, it is not bearish yet.
Since the third November 2020, the EUR/USD pair continued moving upwards from the bottom of 1.1603. So, the pair rose from the level of 1.1603 to the top around 1.1941.
The bulls remain in control. Simply because price action is above most of the moving averages (50 and 100) on multiple time frames. The key breakout would be above the 1.1941 resistance.
The RSI starts signaling an upward trend, as the trend is still showing strength above the moving average (100) and (50). Thus, the market is indicating a bullish opportunity above 1.1867 .
Currently, the price is in a bullish a strong channel. At the present time, the price sets at 1.1927. The first resistance has already formed at the level of 1.1941 and the pair is likely to try to approach it in order to test it again.
The EUR/USD pair continues its attempts to settle above the key resistance level at 1.1941 while the U.S. dollar remains under pressure against a broad basket of currencies.
Moreover, the European Central Bank may become worried about the rise of the euro at some point as stronger euro puts additional pressure on the European economy and on prices in the Euro Area.
The next resistance for the EUR/USD pair is located at 1.1977, but the EUR/USD pair may also face some resistance at the highs of the previous trading session at 1.1941. If EUR/USD manages to settle above the resistance at 1.1941, it will gain upside momentum and head towards the next resistance level at 1.1977.
Consequently, this breakout at 1.1941 should send the EUR/USD pair higher. Immediate targets, however, are located quite nearby at 1.1977 and the round 1.2006 level.
However, if the pair fails to pass through the level of 1.1941, the market will indicate a bearish opportunity below the resistance level of 1.1941 (the double top - a ratio of 100% Fibonacci).
Forecast :
Buy above the level of 1.1867 with the first target at 1.1941so as to test the daily resistance 1 and further to 1.19677. Also, it might be noted that the level of 1.2006 is a good place to take profit because it will form a new double top.
On the other hand, in case a reversal takes place and the GBP/USD pair breaks through the support level of 01.1867, a further decline to 1.1732 can occur which would indicate a bearish market.