 English
  Русский
 Bahasa Indonesia
 Bahasa Malay
 ไทย
ไทย Español
 Deutsch
 Български
 Français
 Tiếng Việt
 中文
中文 বাংলা
বাংলা हिन्दी
 Čeština
 Українська
 Română

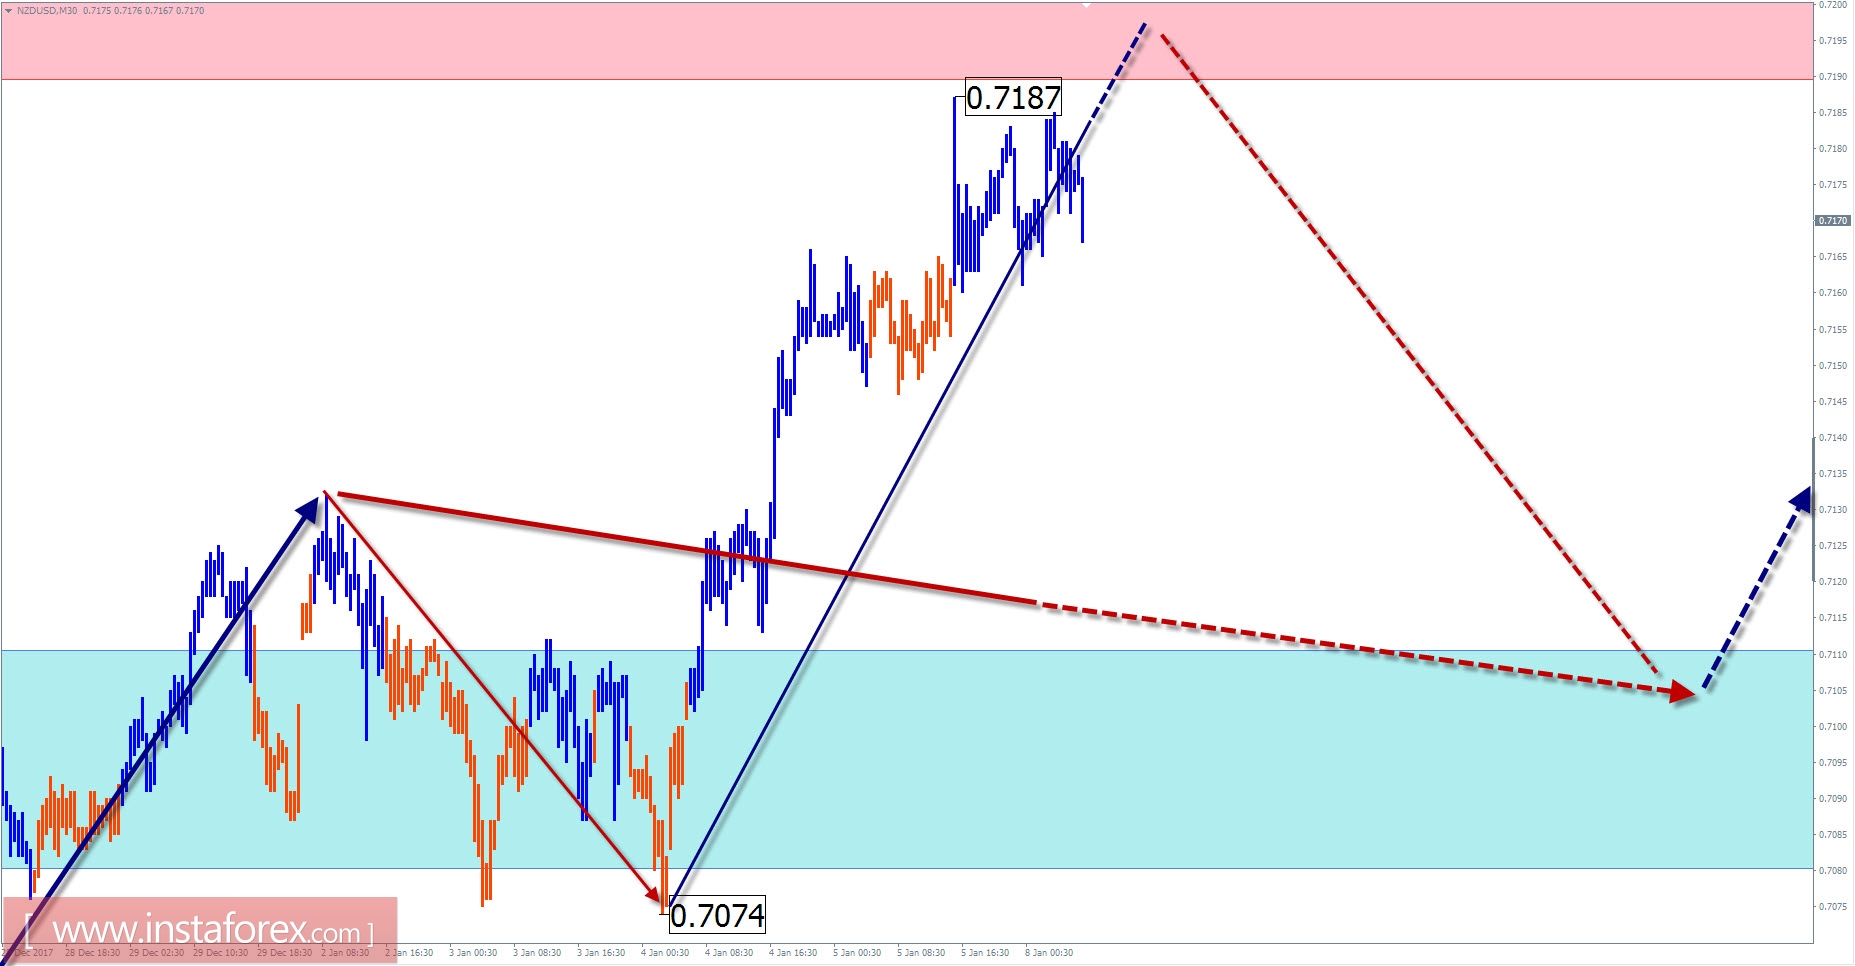
Review and Forecast for NZD / USD
On the daily scale chart of the major pair New Zealand dollar, the price forms an upward correction towards the main wave of July 27 last year. Over the past two months, prices have come close to the preliminary reversal area where the probability of completing the entire current growth has significantly increased. The upward trend direction shown on the weekly chart scale, the option of changing the entire short-term trend is not excluded. But even in this case, the pair's price in the near future is expecting a corrective decline.
In the upcoming trading sessions, quotations should complete the recovery and create conditions for the upcoming traffic. The active phase of decline is expected in the second half of the day or tomorrow.
Boundaries of resistance zones:
- 0.7190 / 0.7220
Boundaries of support zones:
- 0.7110 / 0.7080
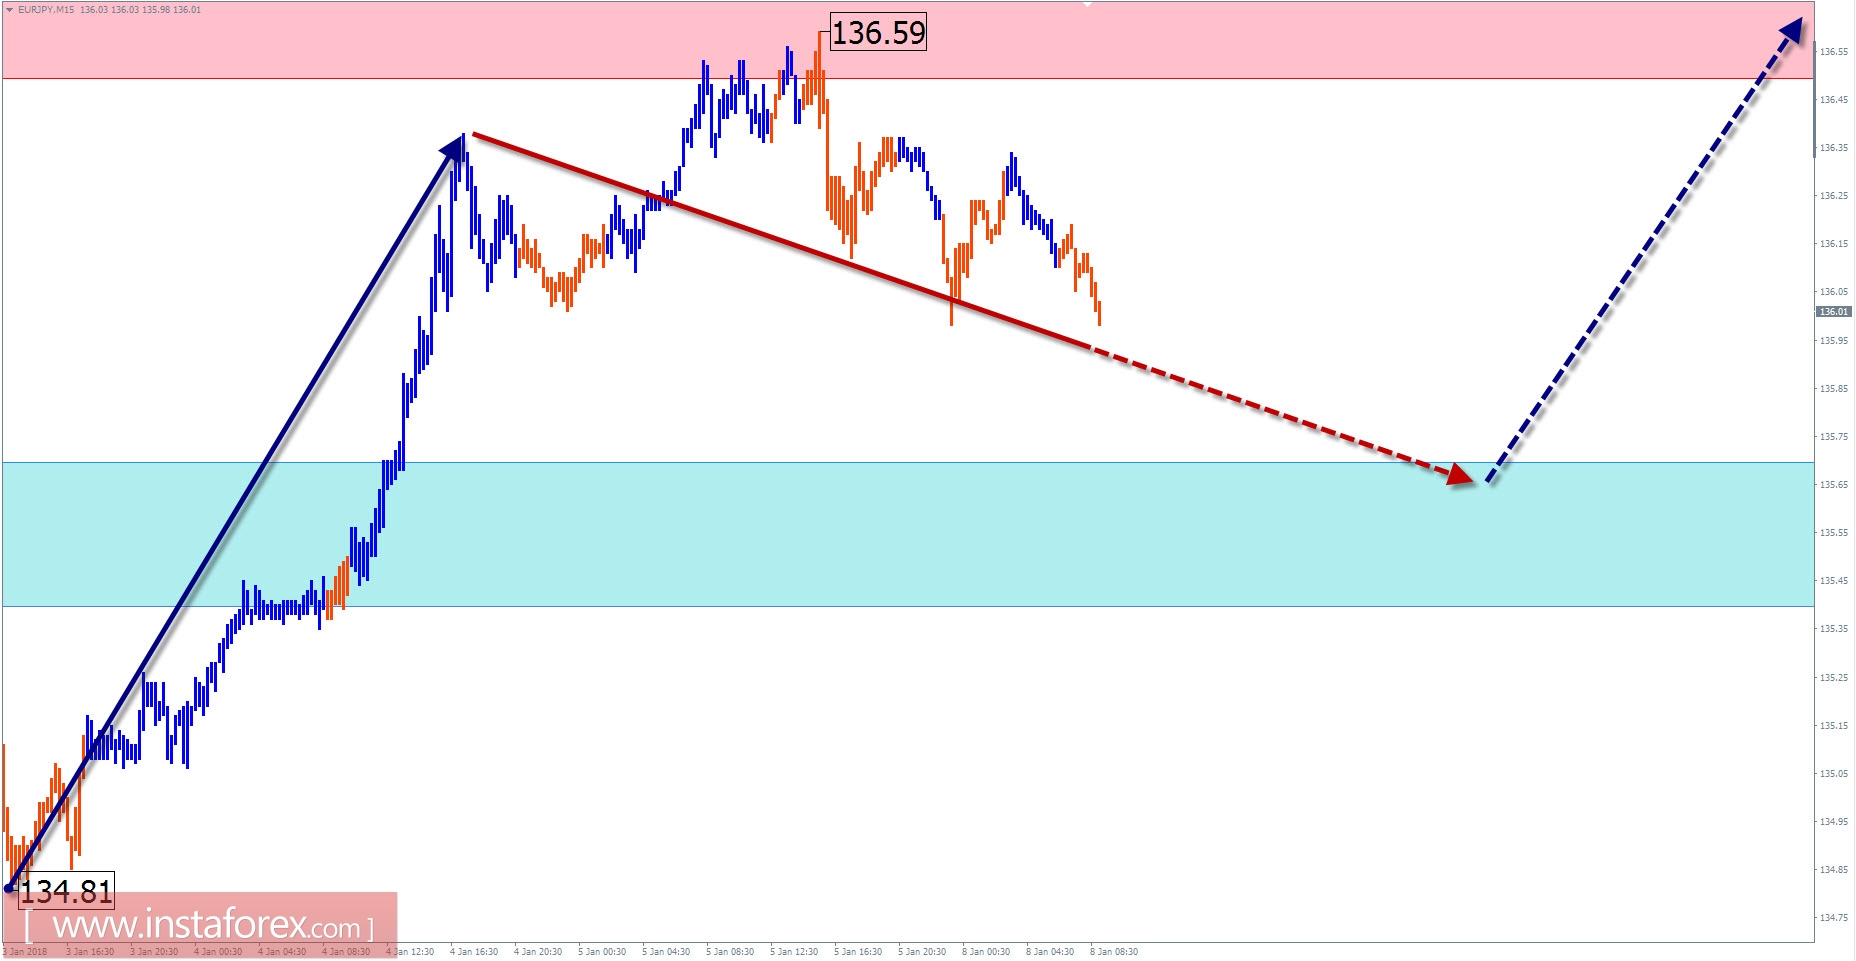
EUR / JPY outlook and outlook
The quotes of the cross pair continue to increase its rally which started since April last year. The preliminary calculation of the probable target zone shows the proximity of its lower boundary, which runs through the middle of the 138th figure. The wave has a pronounced impulsive character with minimal corrections.
The last section of the movement started in the middle since last month. It pushed down the top border of the flat correction corridor, which became a confirmation signal of its completion. Before continuing the upward momentum, quotations need to gain a foothold in the target area of the chart.
This morning, there is a high probability of a downward rollback. The nature of the movement is expected to be flat. The calculated support will move downward, limiting the price movement. Return to the main direction is expected at the end of the day.
Boundaries of resistance zones:
- 136.50 / 80
Boundaries of support zones:
- 135.70 / 40
Explanations to the figures: For simplified wave analysis, a simple waveform is used that combines 3 parts (A; B; C). Of these waves, all kinds of correction are composed and most of the impulses. On each considered time frame the last and incomplete wave is analyzed.
The areas marked on the graphs are indicated by the calculation areas in which the probability of a change in the direction of motion is significantly increased. Arrows indicate the wave counting according to the technique used by the author. The solid background of the arrows indicates the structure formed, the dotted one indicates the expected wave motion.
Attention: The wave algorithm does not take into account the duration of the tool movements in time. The forecast is not a trading signal! To conduct a trade transaction, you need to confirm the signals of your trading systems.
* The presented market analysis is informative and does not constitute a guide to the transaction.