EURUSD remains in a bullish trend according to the Ichimoku cloud indicator. Today we use this indicator to identify key short-term price levels that traders should monitor closely. Although the week started with a new higher high, sellers have taken over and price is on negative territory on Monday.
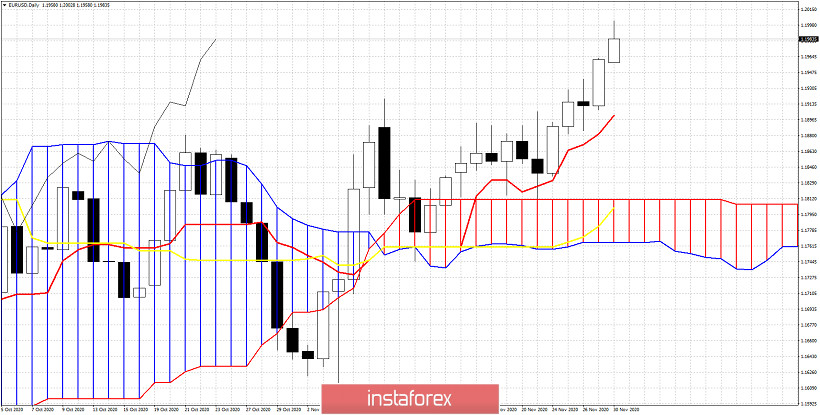
In the Daily chart EURUSD is above both the tenkan-sen (red line indicator) and the kijun-sen (yellow line indicator). The Chikou span (black line indicator) is also above the candlestick bodies and this is also another bullish confirmation, together with the fact that the Kumo (cloud) is below price. Support by the tenkan-sen is at 1.19. As long as the daily close is above this level there is no worry for a bigger pull back. Major short-term support is at 1.1810 area where we find both the kijun-sen and the upper cloud boundary. Holding above the cloud is crucial if bulls want to achieve 1.22-1.23 over the next few weeks.
*The market analysis posted here is meant to increase your awareness, but not to give instructions to make a trade
 English
  Русский
 Bahasa Indonesia
 Bahasa Malay
 ไทย
ไทย Español
 Deutsch
 Български
 Français
 Tiếng Việt
 中文
中文 বাংলা
বাংলা हिन्दी
 Čeština
 Українська
 Română
