 English
  Русский
 Bahasa Indonesia
 Bahasa Malay
 ไทย
ไทย Español
 Deutsch
 Български
 Français
 Tiếng Việt
 中文
中文 বাংলা
বাংলা हिन्दी
 Čeština
 Українська
 Română

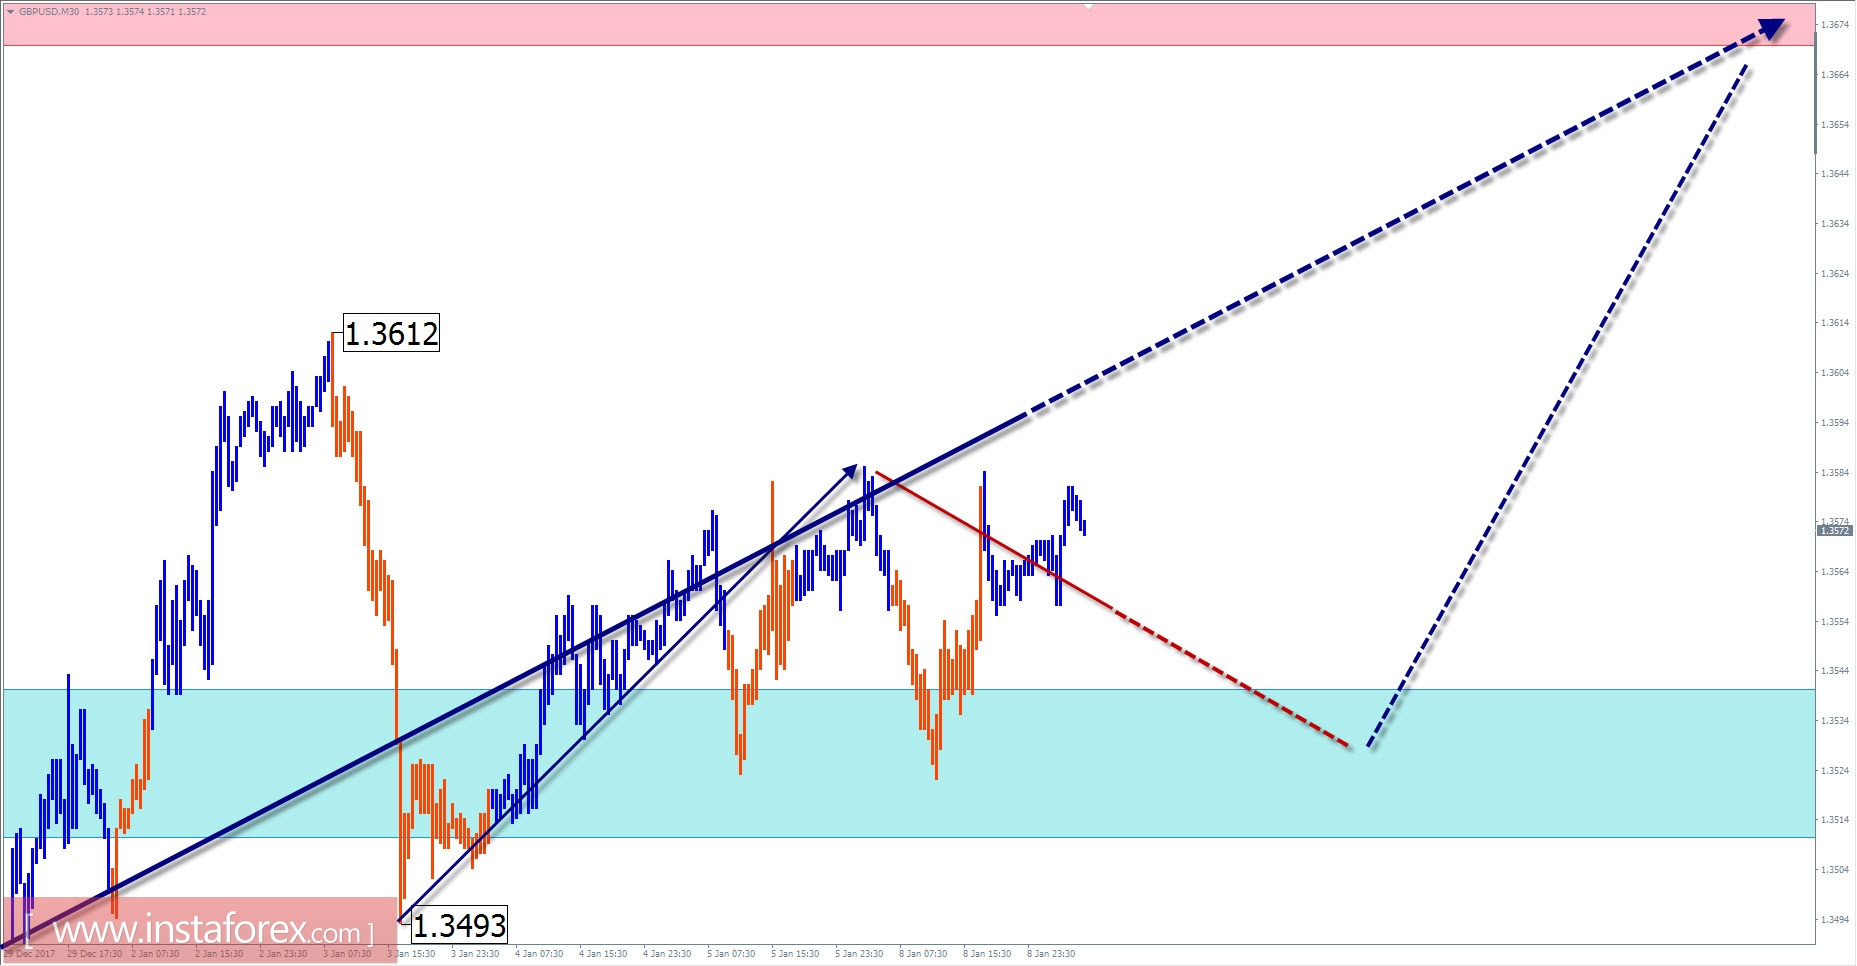
Review and forecast for GBP / USD
The quotations of the major currency British pound last month had strengthened the lower border of the wide potential reversal zone of the chart. Taking into account the completeness of the current upward trend wave, there is a high probability of forming the wave with a counter direction of the same scale.
A descending zigzag has started since September 20 last year which holds a high wave level. After the end of the middle part of the formation, the reversal and the active depreciation of the pair will follow.
This morning, the flat price movement mood is more likely to move in a downward direction. In the subsequent trading sessions, the chance of a return to the upward course and a price increase the major currency will rose sharply. The target of the upgrade will be the lower boundary of the reversal area.
Boundaries of resistance zones:
- 1.3670 / 1.3700
Boundaries of support zones:
- 1.3540 / 10
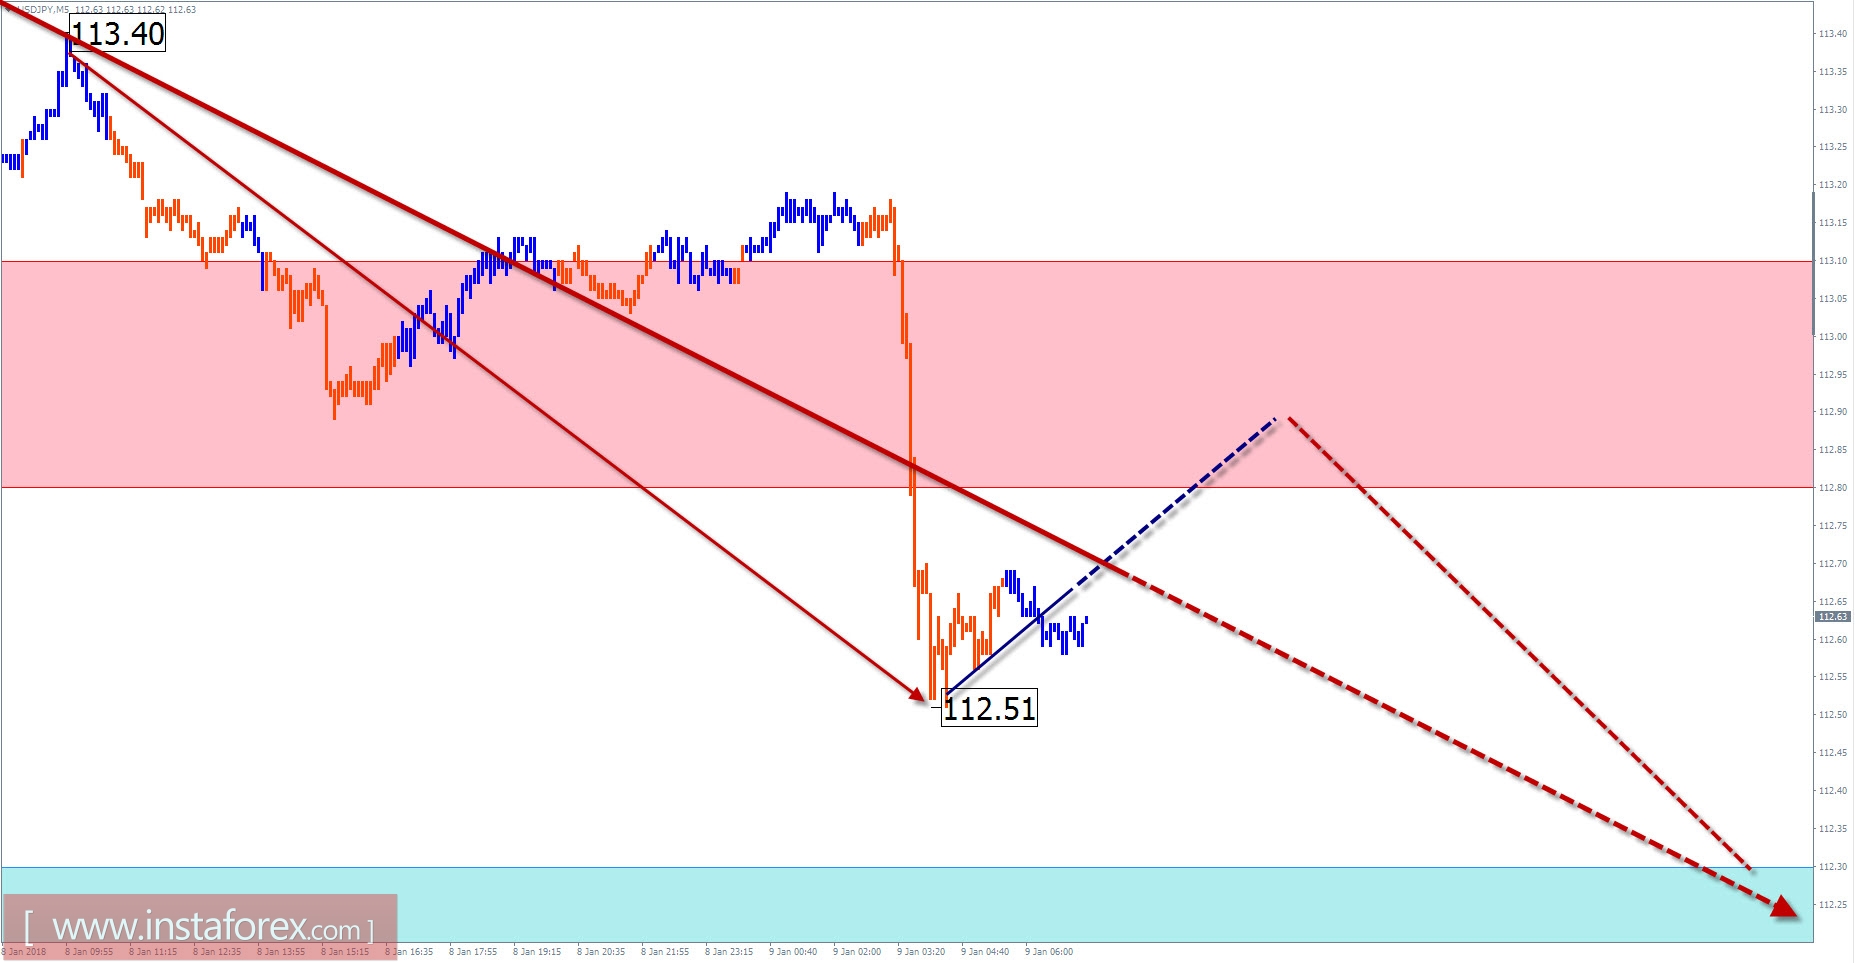
Review and forecast for USD / JPY
The daily scale of the chart for the major pair Japanese yen and the dollar is deprived by the prevailing direction. Price trends are set for smaller time frames, moving quotes within the formed flat corridor.
Since the end of November last year, the last incomplete wave model is much awaited. For two months in the form of a flat triangle, the average and corrective part of the wave (B) is formed. Evaluating the type of structure, it can be assumed that the descending part of the final structure began yesterday.
The flattened mood is not excluded during the first part of the day. The movement of the pair is expected either in the sideways direction or towards the ascending direction. There is no sign of resistance. Further decline is expected at the end of the day.
Boundaries of resistance zones:
- 112.80 / 113.10
Boundaries of support zones:
- 112.30 / 112.00
Explanations to the figures: For simplified wave analysis, a simple waveform is used that combines 3 parts (A; B; C). Of these waves, all kinds of correction are composed and most of the impulses. On each considered time frame the last and incomplete wave is analyzed.
The areas marked on the graphs are indicated by the calculation areas in which the probability of a change in the direction of motion is significantly increased. Arrows indicate the wave counting according to the technique used by the author. The solid background of the arrows indicates the structure formed, the dotted one indicates the expected wave motion.
Attention: The wave algorithm does not take into account the duration of the tool movements in time. The forecast is not a trading signal! To conduct a trade transaction, you need to confirm the signals of your trading systems.
* The presented market analysis is informative and does not constitute a guide to the transaction.