 English
  Русский
 Bahasa Indonesia
 Bahasa Malay
 ไทย
ไทย Español
 Deutsch
 Български
 Français
 Tiếng Việt
 中文
中文 বাংলা
বাংলা हिन्दी
 Čeština
 Українська
 Română

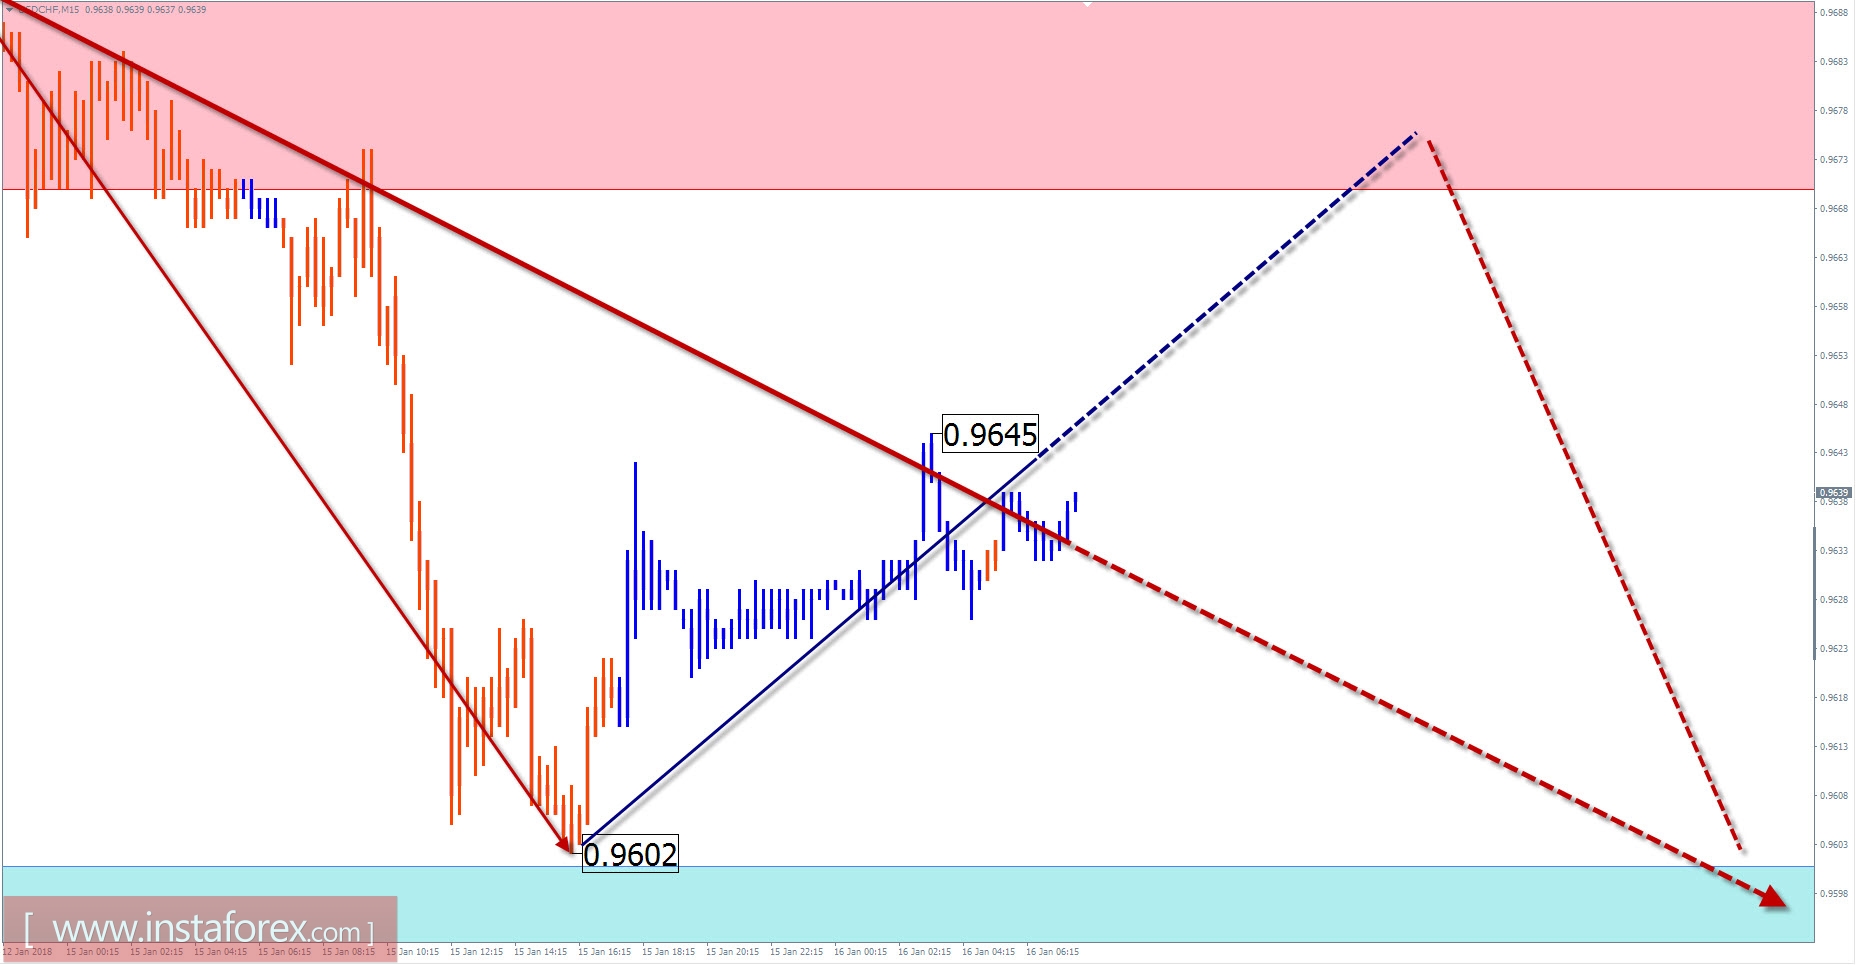
Review and forecast for USD / CHF pair
The weekly scale graphical analysis of the Swiss francs main pair shows a distinct tapering triangle. Since early November last year, there has been a regular phase of a corrective decline. This wave sets the trend rate for the short-term. The calculation of the preliminary target zone indicates the section whose upper limit is in the price figure from the current exchange rate.
Yesterday's active price reduction can be corrected by the price rise today. The possible upward range limits the resistance zone.
By the end of the day, a return to the main motion vector is expected. A breakthrough of the lower limit of settled support is more likely to happen on subsequent trading days.
Boundaries of resistance zones:
- 0.9670 / 0.9700
Boundaries of support zones:
- 0.9600 / 0.9570
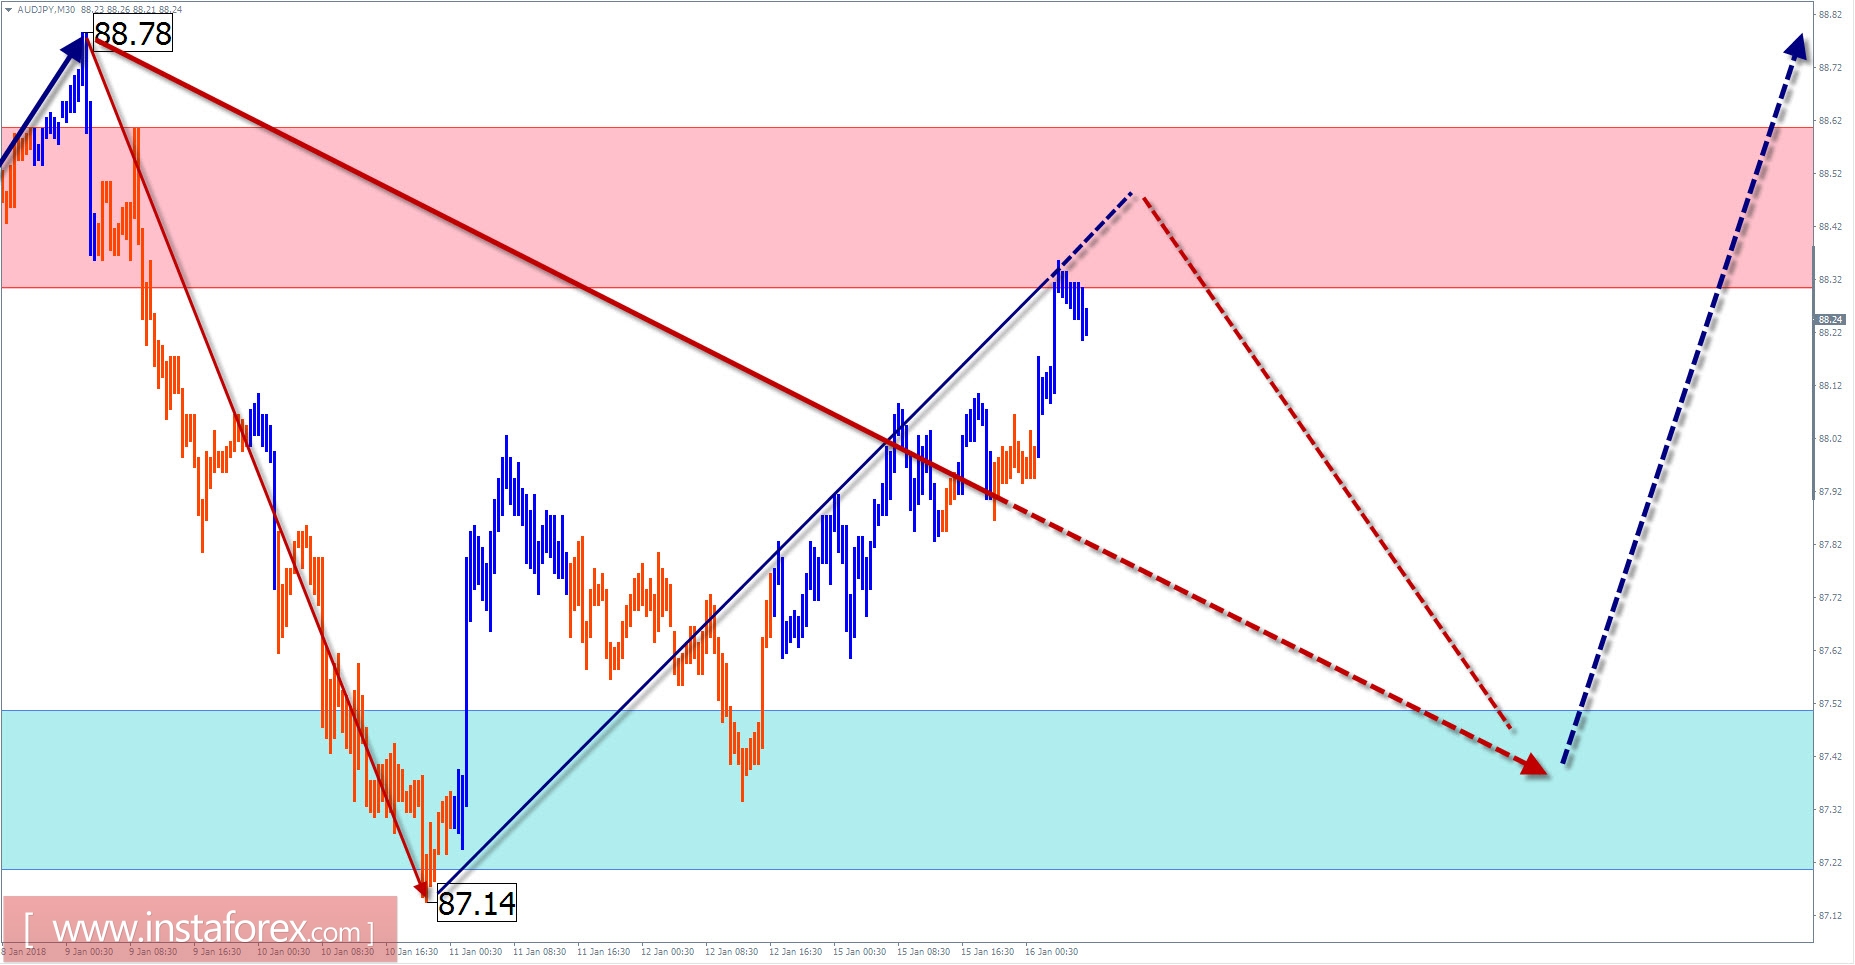
Review and Forecast for AUD / JPY pair
The main trend wave of the AUD/JPY cross pair shifted the pair's price to the lower limit of the powerful potential reversal zone of the chart. Analysis of the last small-scale structure, dated November 27, indicates the incompleteness of this site. Given the width of the critical zone in the area of one and a half price figures, it can be assumed that the bullish mood of the movement will continue in the coming days.
Within the next 24 hours, the most likely scenario for the movement of the pair will be a lateral flat with a descending vector. The range of price fluctuations will be limited by the counter settlement zones. The return to the upward price course is expected at the end of the day or the next day.
Boundaries of resistance zones:
- 88.30 / 60
Boundaries of support zones:
- 87.50 / 20
Explanations of the figures:
For simplified wave analysis, a simple waveform is used that combines 3 parts namely A, B, and C. All types of correction are created and most of the impulses can be found in these waves. Every time frame is considered and the last incomplete wave is analyzed.
The areas marked on the graphs indicate the probability of a change in the direction of motion has significantly increased as calculated in the areas. Arrows indicate the wave counting following the technique used by the author. A solid background of the arrows signifying the structure has been formed while the dotted one means the expected wave motion.
Attention: The wave algorithm does not take into account the duration of the movement of tools in time. The forecast is not a trading signal! To conduct a bargain, you need to confirm the signals used by your trading systems.