 English
  Русский
 Bahasa Indonesia
 Bahasa Malay
 ไทย
ไทย Español
 Deutsch
 Български
 Français
 Tiếng Việt
 中文
中文 বাংলা
বাংলা हिन्दी
 Čeština
 Українська
 Română

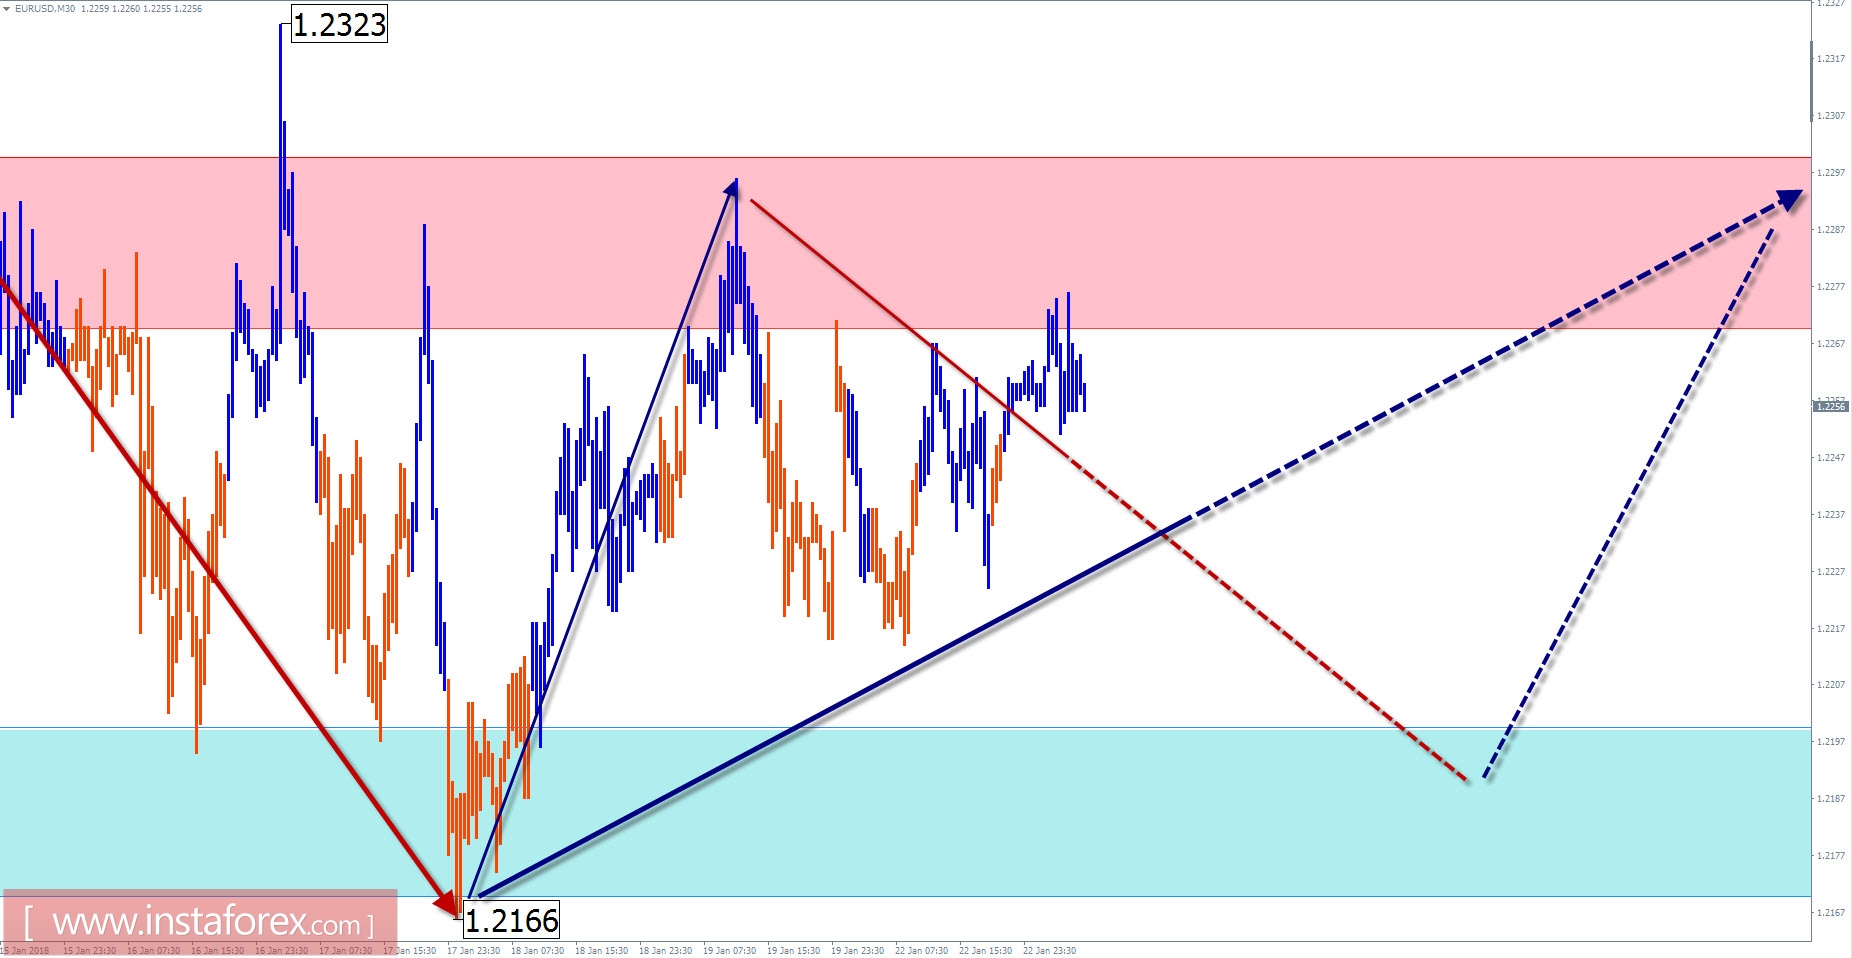
Overview and forecast for EUR / USD
The quotations of the euro, in its main pair against the dollar, have been moving for the last 3 years according to the wave pattern algorithm "the ascending stretched plane". The wave entered the final phase. The chart area reached last week is in the area of strong resistance on a large scale. It is logical to expect from this zone a counter-corrective movement. Given the impulsive nature of the movement of the main wave, the magnitude of the descending movement can be minimal, in the form of an "outset".
Today, the lateral price movement is expected, mainly in the price corridor formed over the past 2 weeks. The European session does not exclude pressure on the resistance zone. By the end of the day, the probability of a pair's depreciation will increase.
The boundaries of the resistance zones:
- 1.2270 / 1.2300
The boundaries of the support zones:
- 1.2200 / 1.2170
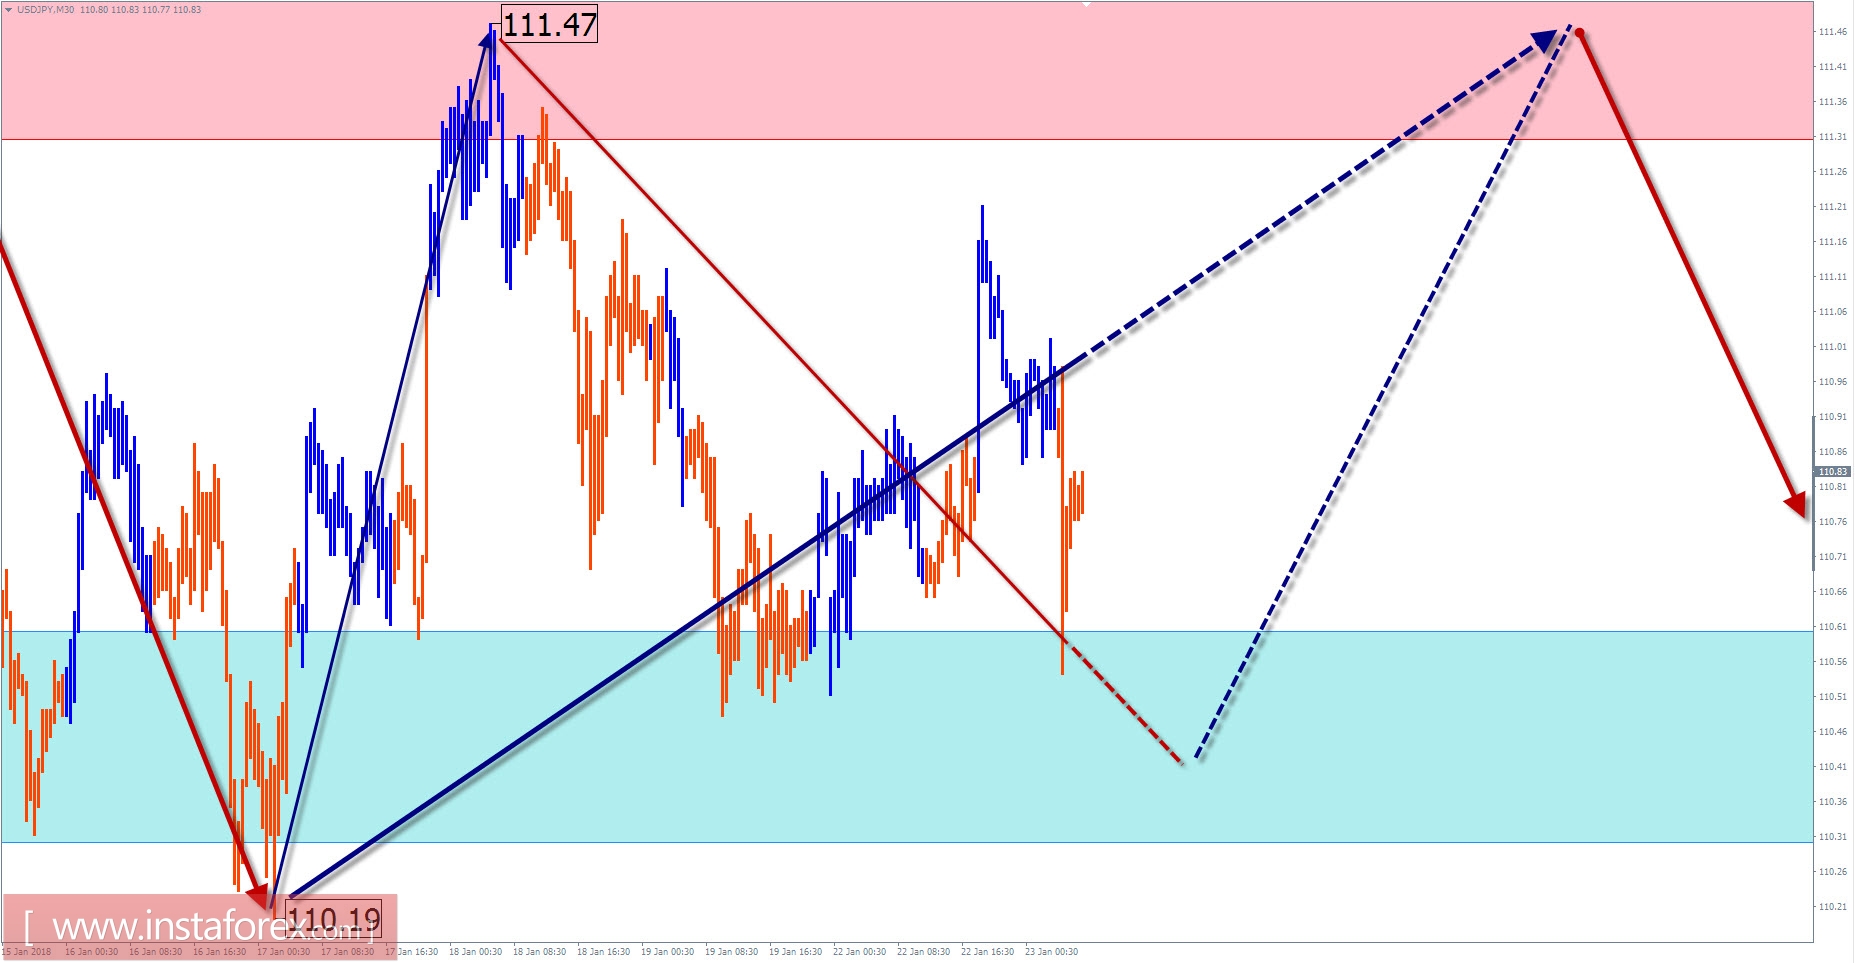
Overview and forecast for USD / JPY
The Japanese yen continues to move in the lateral plane, started at the beginning of last year. If you look at the price extremes on the daily scale of the terminal, you can note the formation of a distinct figure "horizontal triangle".
The last incomplete wave can be considered an ascending zigzag of September 8. Since November, the counter structure of the structure (B) has been formed in the structure of the wave. The preliminary calculation of the target zone allows you to wait for the price move down in the area of 2 price figures.
Today, the most likely scenario will be the flute tone of the movement, mainly with the ascending vector. In the morning, pressure on the support zone is possible. The maximum possible end-of-stroke endpoint indicates the resistance zone. The reversal and breakthrough of the lower border of the flat down today is unlikely.
The boundaries of the resistance zones:
- 111.30 / 60
The boundaries of the support zones:
- 110.60 / 30
Explanations to the figures: For simplified wave analysis, the simplest type of wave is used in the form of a zigzag, combining 3 parts (A; B; C). Of these waves, all kinds of correction are composed and most of the impulses. At each time frame, the last, incomplete wave is analyzed.
The areas marked on the graphs are indicated by the calculation areas, where the probability of a change in the direction of motion is significantly increased. Arrows indicate the wave counting according to the technique used by the author. The solid background of the arrows indicates the structure formed, the dotted one indicates the expected wave motion.
Attention: The wave algorithm does not take into account the duration of the tool movements in time. The forecast is not a trading signal! To conduct a trade transaction, you need to confirm the signals of your trading systems.