 English
  Русский
 Bahasa Indonesia
 Bahasa Malay
 ไทย
ไทย Español
 Deutsch
 Български
 Français
 Tiếng Việt
 中文
中文 বাংলা
বাংলা हिन्दी
 Čeština
 Українська
 Română

Overview and forecast for EUR / USD
According to the price chart of the major pair single European currency, the formation of the prevailing bull wave pattern continues. Preliminary expectations on the beginning of the correction for the corresponding scale were not yet confirmed.
The kind of price movement in the last part (C) of the wave is close to the impulse pattern. Counter areas have a flat or incorrect form in their structure. The last and the ascending segment from November 6, exceeded the level of the previous downward correction last week. Instead of a bearish wave of a larger scale, the price began to form a new ascending zigzag.
Today, the flattened mood is highly expected during the first half of the day. By the end of the day, there is a chance for a reversal in the prevailing direction of the rising price movement.
Boundaries of resistance zones:
- 1.2450 / 80
Boundaries of support zones:
- 1.2360 / 30

Review and forecast for USD / JPY
After a period of active price growth in 2016, the quotes of the major currency Japanese yen formed a corrective phase. The last part of the trend was a bearish wave, since November 6 last year. The preliminary calculation of the nearest zone is an area where it is possible to expect for the completion of the current decline. It indicates a benchmark in the region of 3 price figures below the current values.
There is a need for another correction within the current wave of the previous days. Taking into account the major decline which is close to the impulse, appears to be unfavorable to depend on the large scale of the price increase.
In the next session, further growth of quotations is expected. The resistance zone provides a benchmark for the price rise level. Then the USD/JPY exchange rate is expected for a reversal to the prevailing direction.
Boundaries of resistance zones:
- 109.30 / 60
Boundaries of support zones:
- 108.50 / 20
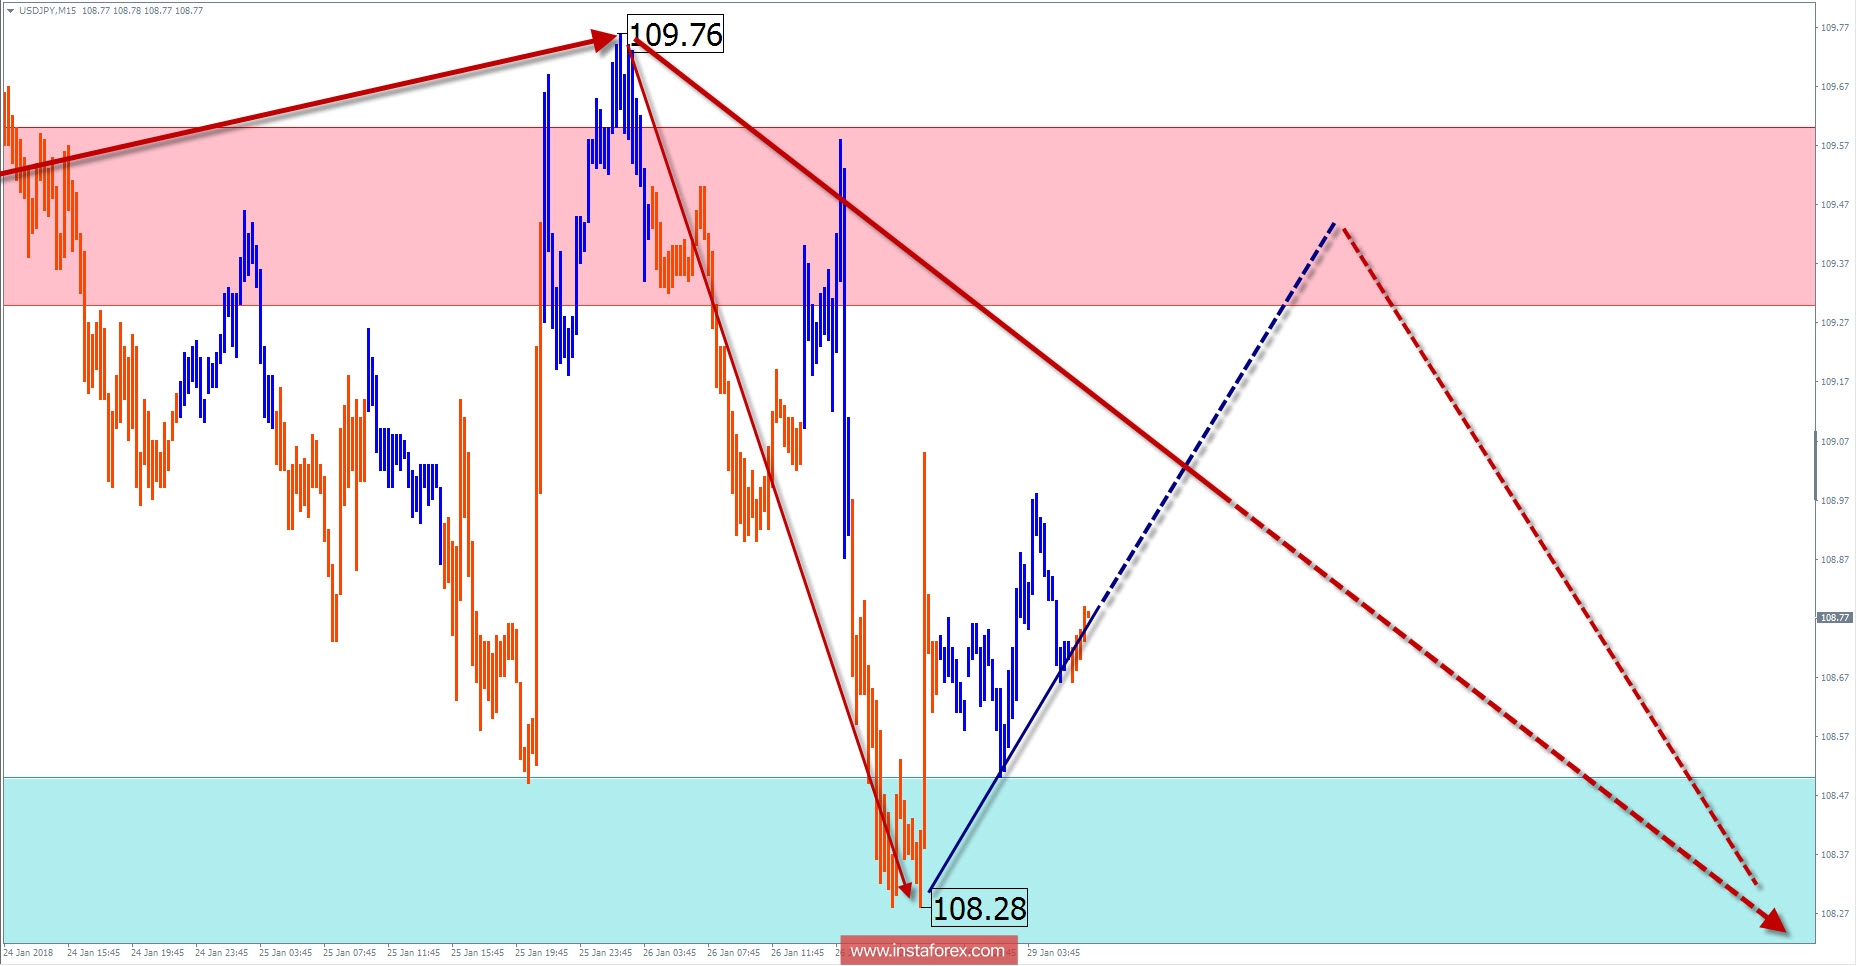
Explanations to the figures: For simplified wave analysis, the simplest type of wave is used in the form of a zigzag, combining 3 parts (A; B; C). Of these waves, all kinds of correction are composed and most of the impulses. At each time frame, the last, incomplete wave is analyzed.
The areas marked on the graphs are indicated by the calculation areas, where the probability of a change in the direction of motion is significantly increased. Arrows indicate the wave counting according to the technique used by the author. The solid background of the arrows indicates the structure formed, the dotted one indicates the expected wave motion.
Attention: The wave algorithm does not take into account the duration of the tool movements in time. The forecast is not a trading signal! To conduct a trade transaction, you need to confirm the signals of your trading systems.
* The presented market analysis is informative and does not constitute a guide to the transaction.