 English
  Русский
 Bahasa Indonesia
 Bahasa Malay
 ไทย
ไทย Español
 Deutsch
 Български
 Français
 Tiếng Việt
 中文
中文 বাংলা
বাংলা हिन्दी
 Čeština
 Українська
 Română

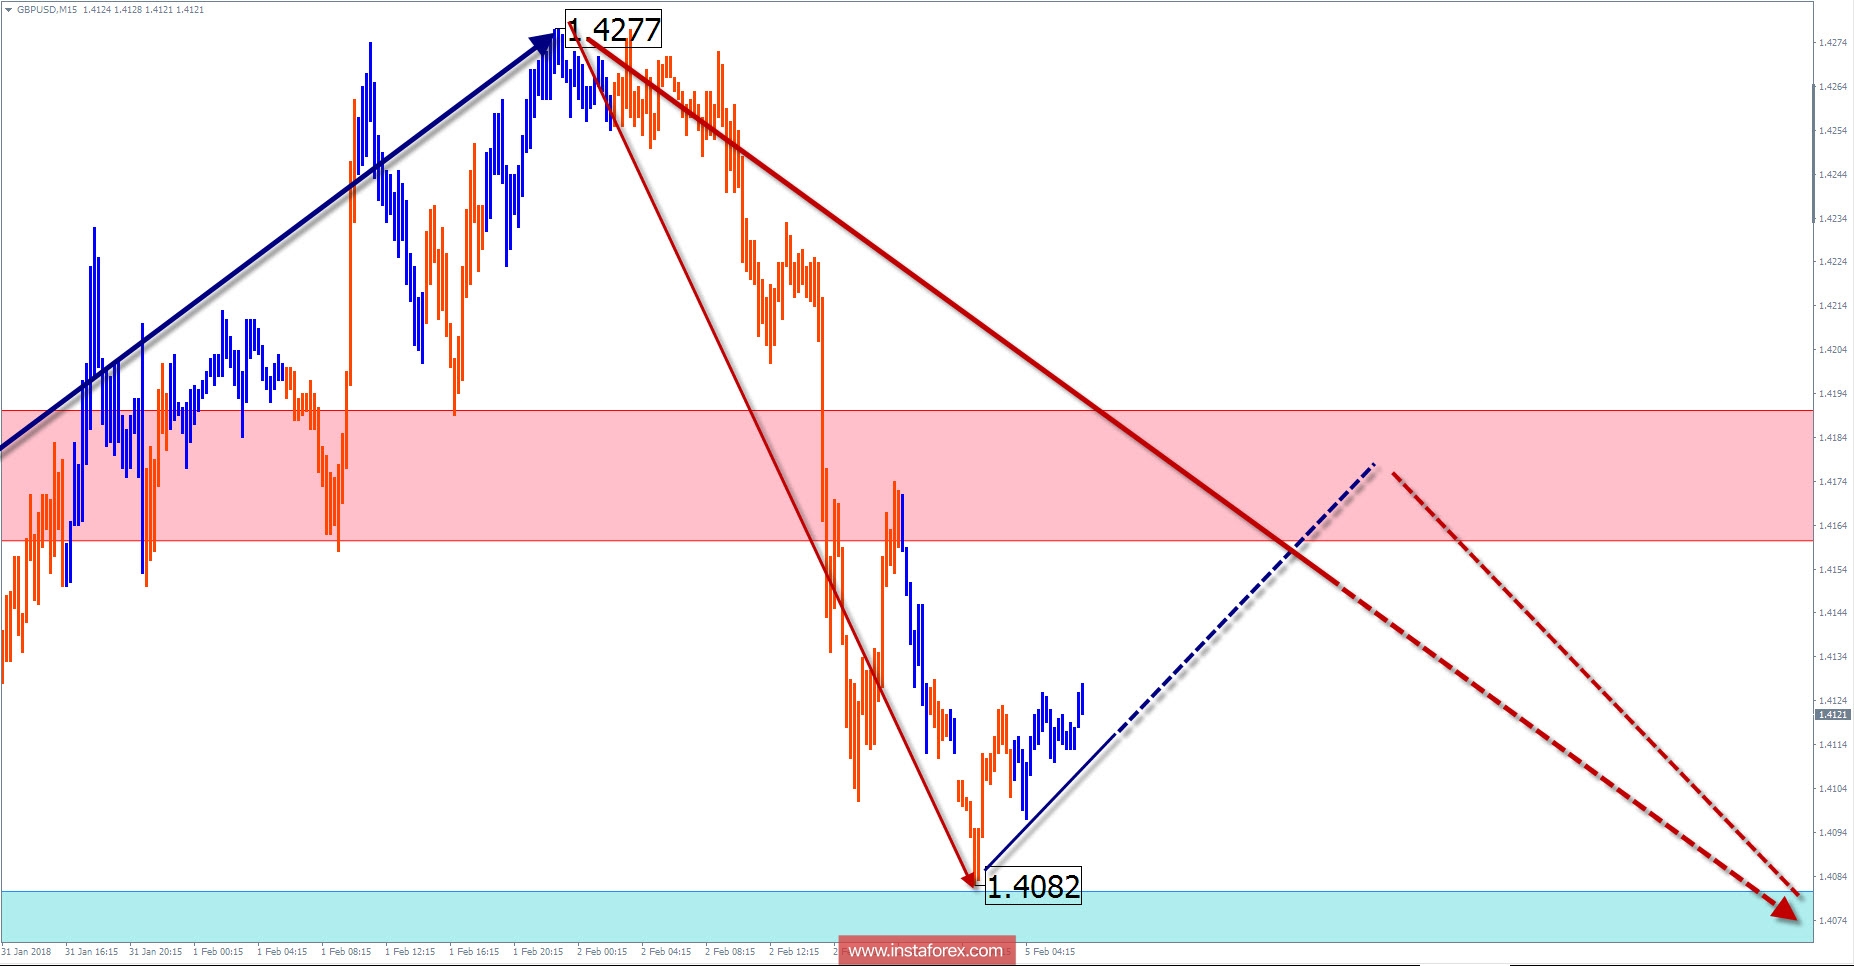
Review and forecast for GBP / USD
The trend direction for the major pair, British pound and dollar, since October 2016 is set by an upward wave. In a larger-scale wave model, this section takes the place of correction. The wave level of the current movement can potentially develop over time in the correctional framework.
In the past couple of weeks, the pair's quotes reached a powerful counter zone where it passed through some resistance levels of different scale. Since January 25, a downward corrective zigzag began to form. Analyzing the type of wave structure, you can depend only the insignificant trend of the price downward, within the area of 2 price figures from the current exchange rate of the pair.
In the following days, the resumption of the descending trend that began last week is expected. Today, the sideways flat is highly expected in the first half of the day.
Boundaries of resistance zones:
- 1.4160 / 90
Boundaries of support zones:
- 1.4080 / 50
Review and forecast for USD / CAD
The trajectory of the major Canadian dollar chart since January 2016 forms a bearish wave. Its last incomplete section has been counting since May last year. After the bullish corrective segment, since the end of October, the price trend moves again with the prevailing course.
Within the framework of the fundamental wave since January 5, the quotations form a correction. The form of its structure takes an incorrect form. At the end of the week, it is possible to observe a price surge on the final part (C). The last extremum of the price rests on the lower boundary of the calculated target zone.
Today, the completion of this form is expected. The expected level of recovery is the resistance zone. Furthermore, the change of direction and a repeated decrease is possible.
Boundaries of resistance zones:
- 1.2480 / 1.2510
Boundaries of support zones:
- 1.2400 / 1.2370
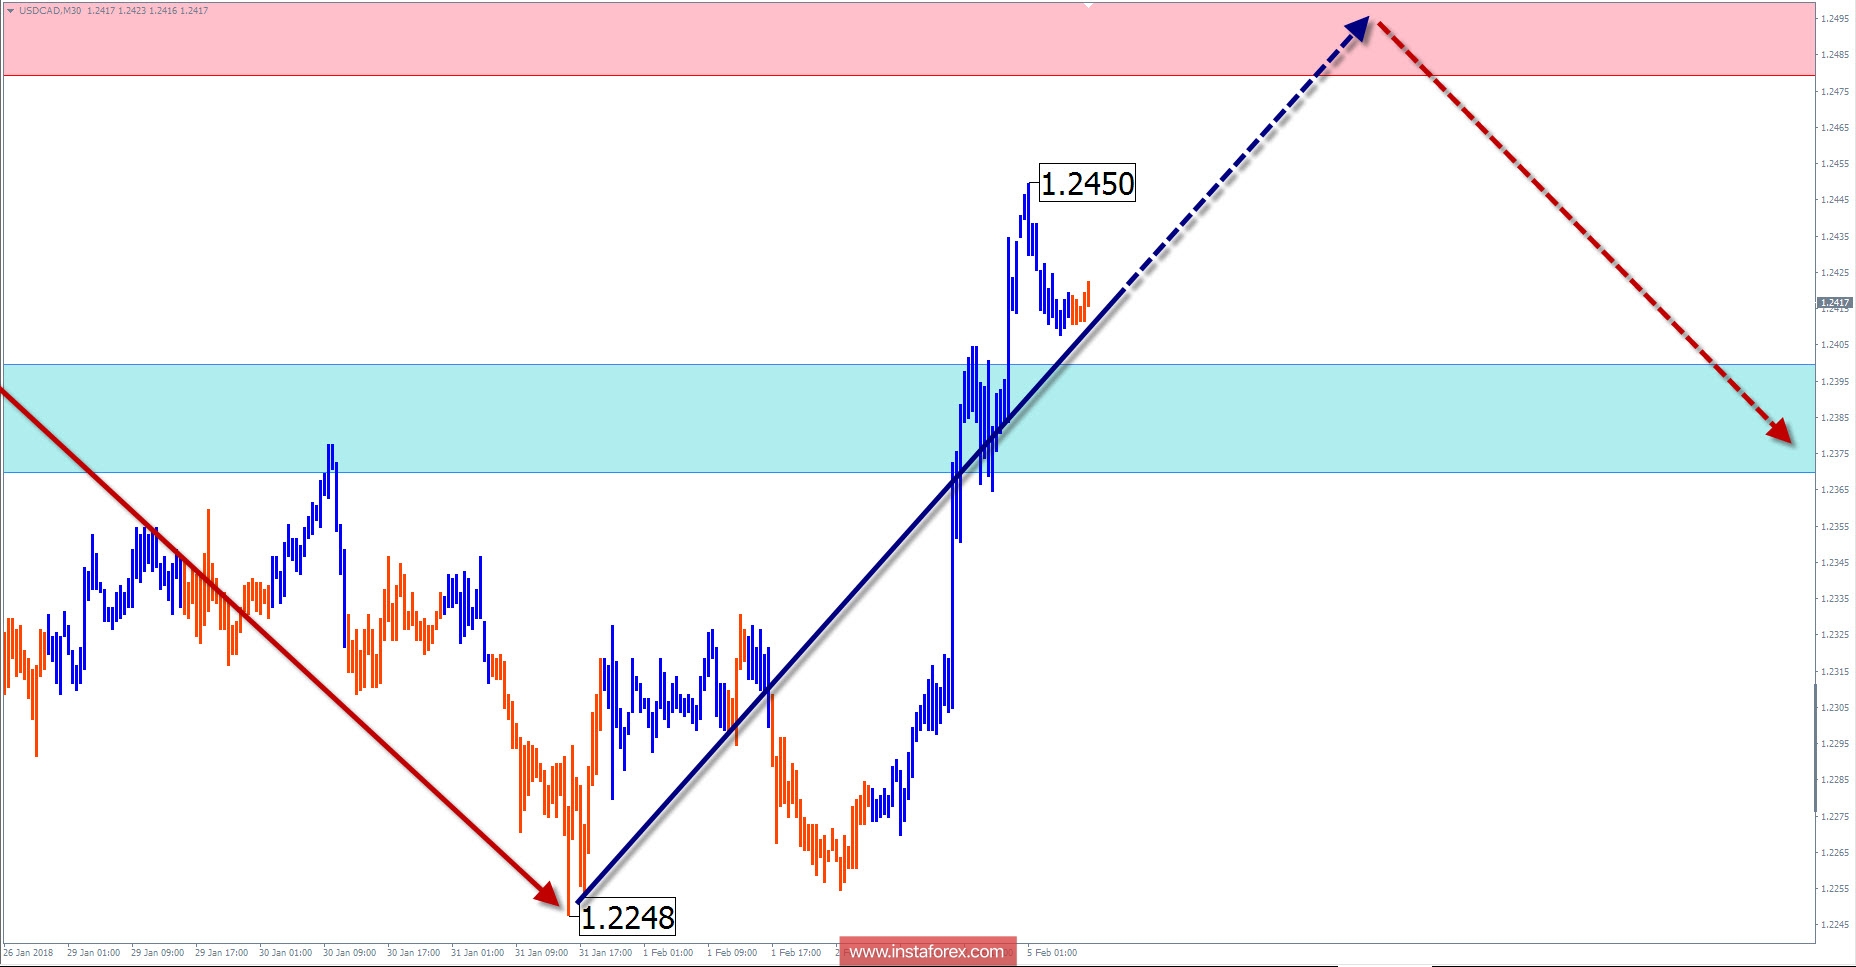
Explanations to the figures: For simplified wave analysis, the simplest type of wave is used in the form of a zigzag, combining 3 parts (A; B; C). Of these waves, all kinds of correction are composed and most of the impulses. At each time frame, the last, incomplete wave is analyzed.
The areas marked on the graphs are indicated by the calculation areas, where the probability of a change in the direction of motion is significantly increased. Arrows indicate the wave counting according to the technique used by the author. The solid background of the arrows indicates the structure formed, the dotted one indicates the expected wave motion.
Attention: The wave algorithm does not take into account the duration of the tool movements in time. The forecast is not a trading signal! To conduct a trade transaction, you need to confirm the signals of your trading systems.
* The presented market analysis is informative and does not constitute a guide to the transaction.