 English
  Русский
 Bahasa Indonesia
 Bahasa Malay
 ไทย
ไทย Español
 Deutsch
 Български
 Français
 Tiếng Việt
 中文
中文 বাংলা
বাংলা हिन्दी
 Čeština
 Українська
 Română

EUR / USD
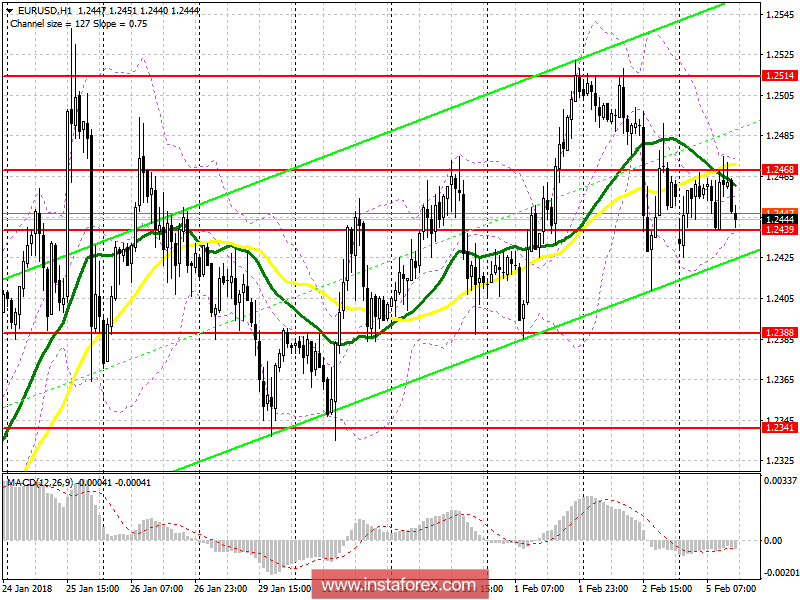
To open long positions on EURUSD, it is required:
Buyers failed to gain a foothold on their first try today at the level of 1.2468. In connection with this, making new purchases of the euro is best after a false breakdown from 1.2439 or after a decrease in the afternoon to a larger support level of 1.2388. A breakout at the level of 1.2468 could lead to a high seen on Friday of last week with an update level of 1.2558, where it is recommended to lock in profits.
To open short positions on EURUSD, it is required:
The formation of a false breakout at 1.2468 occurred and now sellers need to gain a foothold below 1.2439, which could lead to a correction of the euro in the afternoon to the support area of 1.2388. The main purpose is updating to the level of 1.2341, where it is recommended to lock in profits. With a growth option above 1.2468, selling the euro can be on the rebound from 1.2514.
GBP / USD
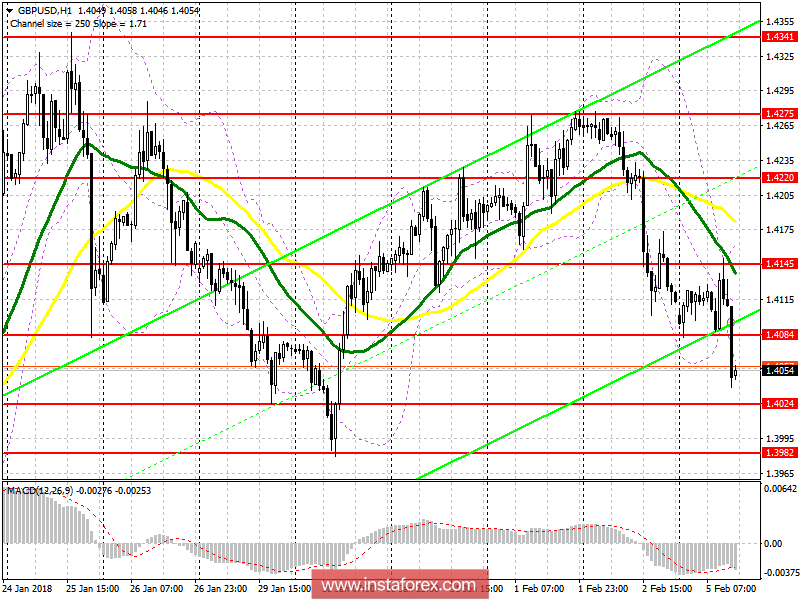
To open long positions on GBP / USD, it is required:
It is best to make new purchases of the pound only after forming a false breakout in the support area of 1.4024 or a better option could be to wait for an update at the level of 1.3982 and buy GBP / USD from there immediately for a rebound. In case of return and consolidation above the level of 1.4084, the demand for the pound may return, which will lead to the renewal of the morning resistance at the level of 1.4145.
To open short positions on GBP / USD, it is required:
While the trade is below 1.4084, we can expect further decline in the GBP / USD to the area of the larger support of 1.4024 with the likely upgrade at 1.3982, where it is recommended to lock in profits. In case of a return to 1.4085 in the afternoon, you can immediately open a new short position to rebound from the resistance level of 1.4145.
Indicator description
MA (moving average) 50 days - yellow
MA (moving average) 30 days - green
MACD: fast EMA 12, slow EMA 26, SMA
Bollinger Bands 20