 English
  Русский
 Bahasa Indonesia
 Bahasa Malay
 ไทย
ไทย Español
 Deutsch
 Български
 Français
 Tiếng Việt
 中文
中文 বাংলা
বাংলা हिन्दी
 Čeština
 Українська
 Română

Analysis of wave counting:
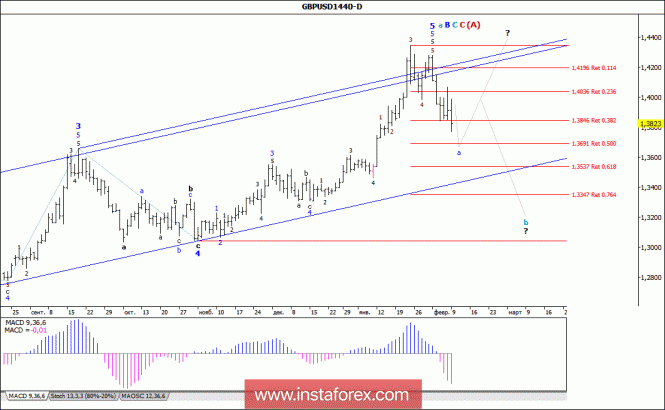
In general, it is expected that during the trades of the past week, the GBP / USD pair started with a downward movement, having lost more than 380 percentage points in price and broke through the level of the 38th figure on Friday. Thus, the emerging wave situation makes it possible to consider the maximum reached on February 1 as the vertex, which took a somewhat shortened form of the wave 5, 5, a, B, C, C, (A), and the subsequent decrease to the mark of 1.3765 as the process of formation of the first generating waves in the composition of the future wave b, B, C, C, (A). At the same time, the currency pair still retains the potential for resuming the growth of quotations at least to the level of 1.4600 and a significant complication of the internal wave structure of not only the wave 5, a, B, C, C, (A ), but, possibly, the entire wave a, B, C, C, (A).
The objectives for working off a variant with a downward wave:
1.3691 - 50.0% of Fibonacci
1.3537 - 61.8% of Fibonacci
The objectives for working out the variant with an upward wave:
1.4400 - 1.4600
General conclusions and trading recommendations:
The pound sterling continues to build wave B, C, C, (A). This week, the lowering of quotations may continue within the wave b, B, C, C, (A) with targets near the marks of 1.3691 and 1.3537, which corresponds to 50.0% and 61.8% of Fibonacci. An upward corridor preserves the prospects of constructing an ascending set of waves.