 English
  Русский
 Bahasa Indonesia
 Bahasa Malay
 ไทย
ไทย Español
 Deutsch
 Български
 Français
 Tiếng Việt
 中文
中文 বাংলা
বাংলা हिन्दी
 Čeština
 Українська
 Română

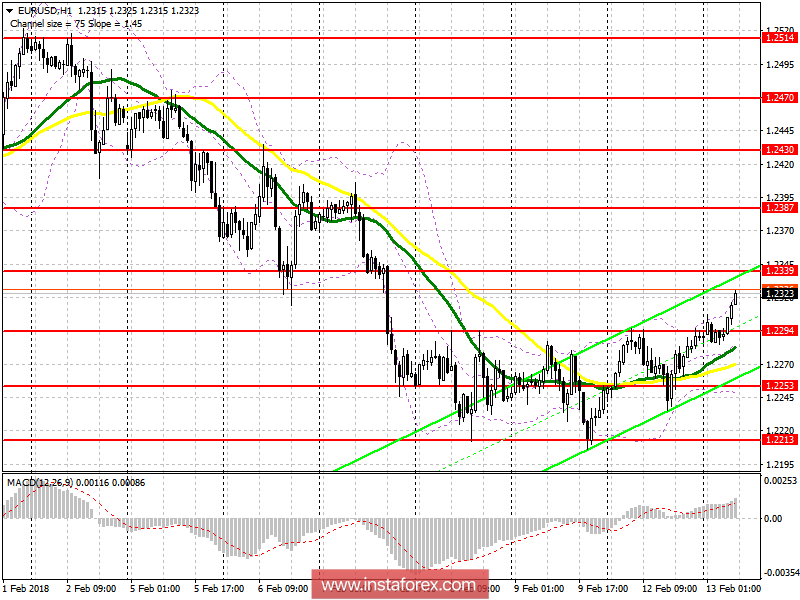
EUR / USD
To open long positions for EURUSD, you need:
Opening new long positions in the European currency is best after a correction and the formation of a false breakout at 1.2294, or on a rebound from the larger support level of 1.2253. A break and consolidation above 1.2339 will also allow us to expect a continuation of the EUR / USD growth with the purpose of updating to 1.2387, where it is recommended to lock in profits.
To open short positions for EURUSD, you need:
The formation of a false breakout at 1.2339 could lead to a downward trend for the euro in the morning in the support area of 1.2294. A consolidation below this level would push EUR / USD down into the region of a larger level of 1.2253, where it is recommended to lock in profits. With a growth option above 1.2339, selling the euro can be rebounded from 1.2387.
GBP / USD
To open long positions for GBP / USD, you need:
The further movement of the pound will depend entirely on inflation data. Good data will lead to the breakdown of 1.3884 and a further GBP / USD growth in the resistance area of 1.3957 with the main target of 1.4062, where it is recommended to lock in profits. In case of a decline at 1.3827, you can count on buying a pound after the formation of a false breakout at 1.3769 or on a rebound from 1.3707.
To open short positions for GBP / USD, you need:
Bad inflation data will lead to the breakdown of 1.3827 and a larger sellout of GBP / USD in the support area of 1.3769 and 1.3707, where it is recommended to lock in profits. In case of growth above 1.3884, consider opening short positions after a false breakdown at 1.3957 or on a rebound from 1.4062.

Indicator description
MA (moving average) 50 days - yellow
MA (moving average) 30 days - green
MACD: fast EMA 12, slow EMA 26, SMA 9
Bollinger Bands 20