 English
  Русский
 Bahasa Indonesia
 Bahasa Malay
 ไทย
ไทย Español
 Deutsch
 Български
 Français
 Tiếng Việt
 中文
中文 বাংলা
বাংলা हिन्दी
 Čeština
 Українська
 Română

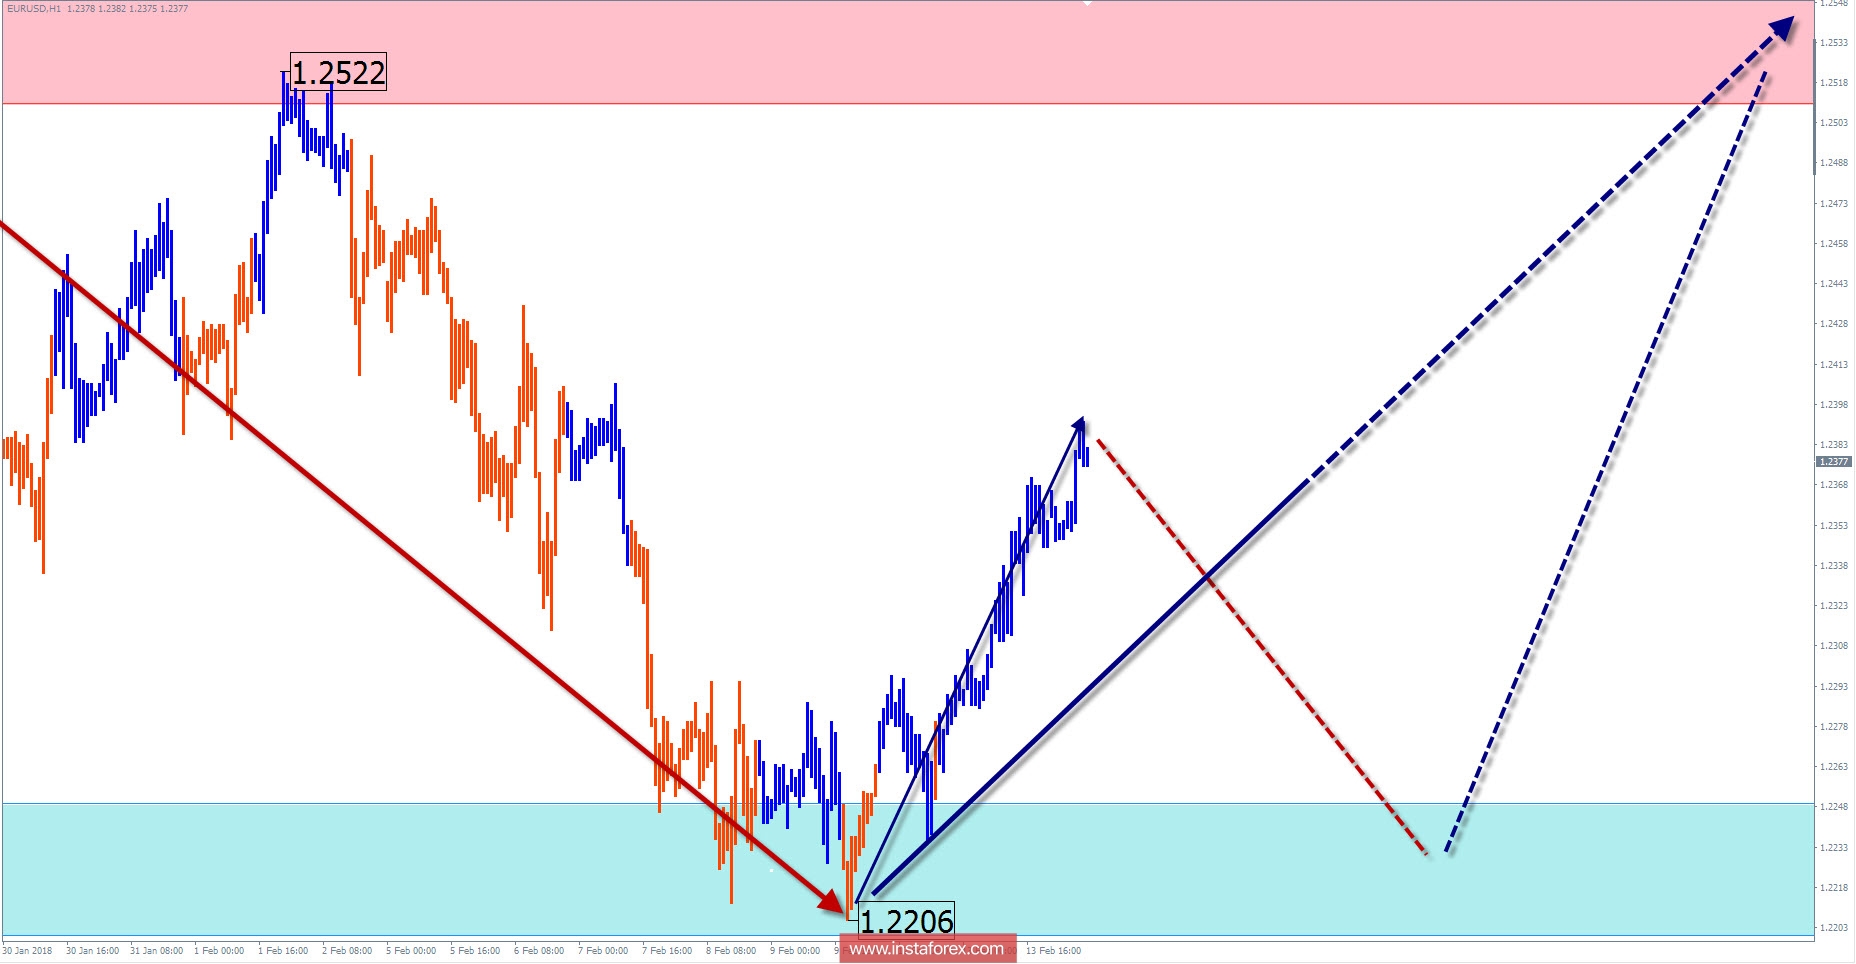
Overview and forecast for EUR / USD currency pair
The weekly scale of the price chart of the main euro pair since the middle of 2008 gives a clear direction to the dominant trend. The counter section of the traffic counts down from January 2015. This upward wave model does not go beyond correction by its wave level. Accordingly, after its completion, one can expect a return to the dominant direction of the course.
The current wave is formed in the form of an ascending figure "stretched plane". The wave structure for today does not demonstrate completeness. The preliminary calculation of the most probable nearest recovery target indicates the zone around the 129th price figure.
The current price decrease in the last 3 weeks has formed an intermediate pullback, the potential of which is nearing completion. Next week, the completion and a new round of price growth are expected.
The boundaries of resistance zones:
- 1.2510 / 60
The boundaries of support zones:
- 1.2250 / 1.2200
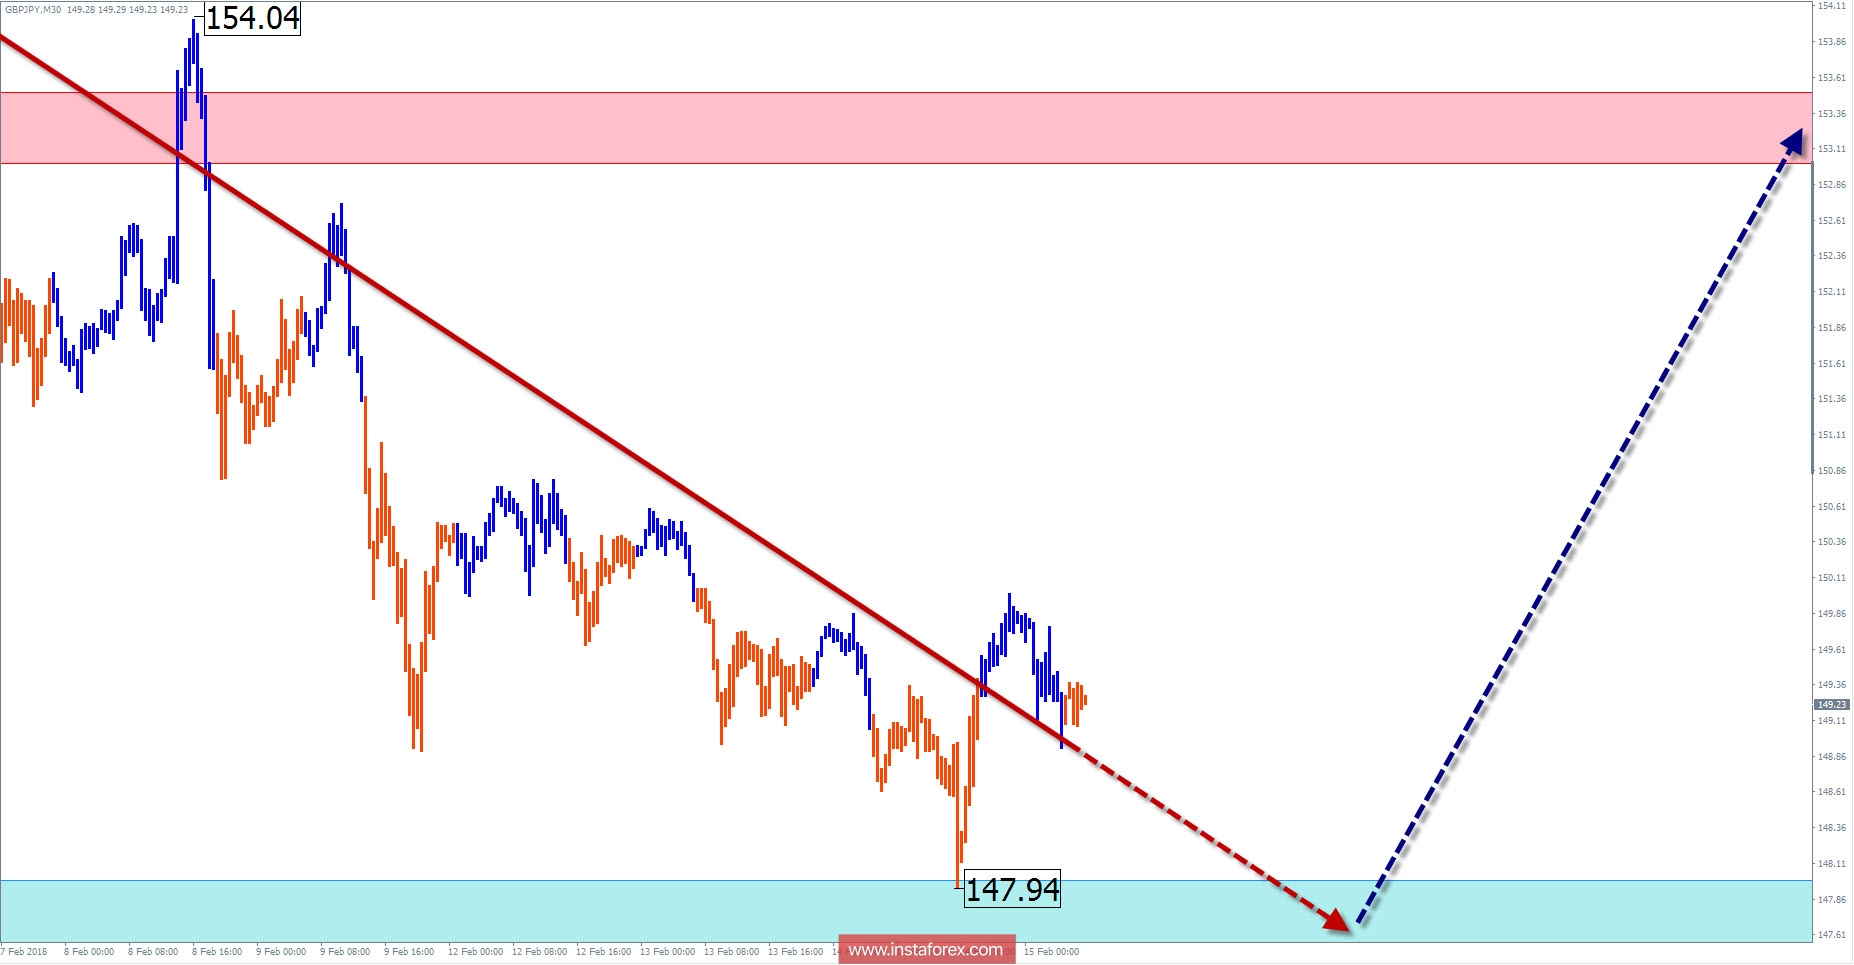
Overview and forecast for GBP / JPY
The rising wave that began in October 2016 has the potential for further growth. This movement demonstrated a high wave level, which is beyond the correction of the previous bear plot of the chart. The extremes of the graph over the past 2 years have formed a fairly distinct upward triangle, the rays of which converge in about 15 price figures above the current value of the price. When calculating the preliminary target area, this level corresponds to the upper boundary of the wide potential reversal zone.
The wave analysis of recent months shows the formation of an incorrect bearish correction on the chart. Judging by the type of its structure, its completion should be expected in the coming days, in the area of settlement support. Next, the price of the pair is waiting for a turn and a second rise up.
The boundaries of resistance zones:
- 153.00 / 153.50
The boundaries of support zones:
- 148.00 / 147.50
Explanations to the figures: For simplified wave analysis, the simplest type of wave is used in the form of a zigzag, combining 3 parts (A; B; C). Of these waves, all kinds of correction are composed and most of the impulses. At each time frame, the last, incomplete wave is analyzed.
The areas marked on the graphs are indicated by the calculation areas, where the probability of a change in the direction of motion is significantly increased. Arrows indicate the wave counting according to the technique used by the author. The solid background of the arrows indicates the structure formed, the dotted one indicates the expected wave motion.
Attention: The wave algorithm does not take into account the duration of the tool movements in time. The forecast is not a trading signal! To conduct a trade transaction, you need to confirm the signals of your trading systems.