 English
  Русский
 Bahasa Indonesia
 Bahasa Malay
 ไทย
ไทย Español
 Deutsch
 Български
 Français
 Tiếng Việt
 中文
中文 বাংলা
বাংলা हिन्दी
 Čeština
 Українська
 Română

This week, we can observe the continuation of the formation of a downward medium-term model, the purpose of which is the test of the monthly control zone of February 1.2187-1.2146. Any growth in the pair will be corrective until the pair of trades below the level of 1.2444.
Medium-term plan.
The decline in the current week, it allows the continuation of the growth in the previous week, which indicates the presence of pressure on the course of the main regulators. To continue the downward movement, it is sufficient for the pair when it is traded below the weekly short-term curve of 1.2444. Obtaining more favorable prices for sale is possible in the case of the test in the younger control zones. The goal of the fall is the short-term target in the range of 1.2203 - 1.2187, which is on the border of the monthly short-term meeting in February in the range of 1.2187 - 1.2146. The achievement of this zone will allow fixation of all sales that were opened earlier.
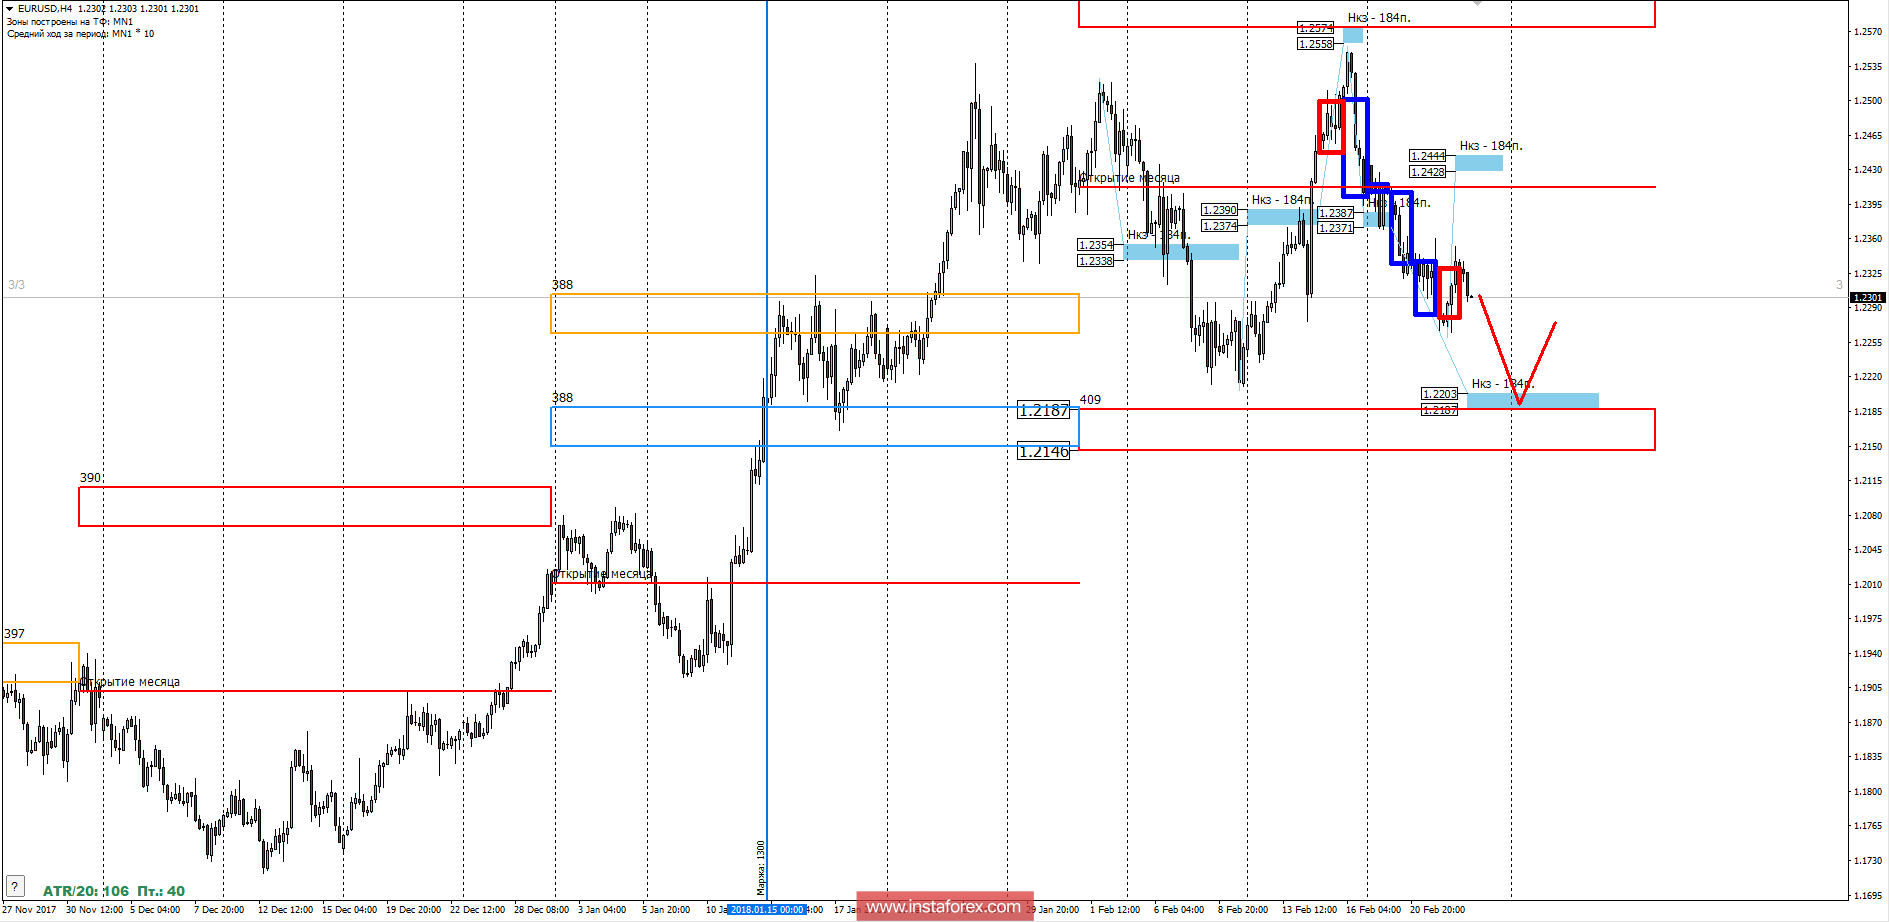
For the formation of an alternative model, growth above the Thursday high is required during the US trading session. This will allow for the short-term fault between 1.2444 and 1.2428.
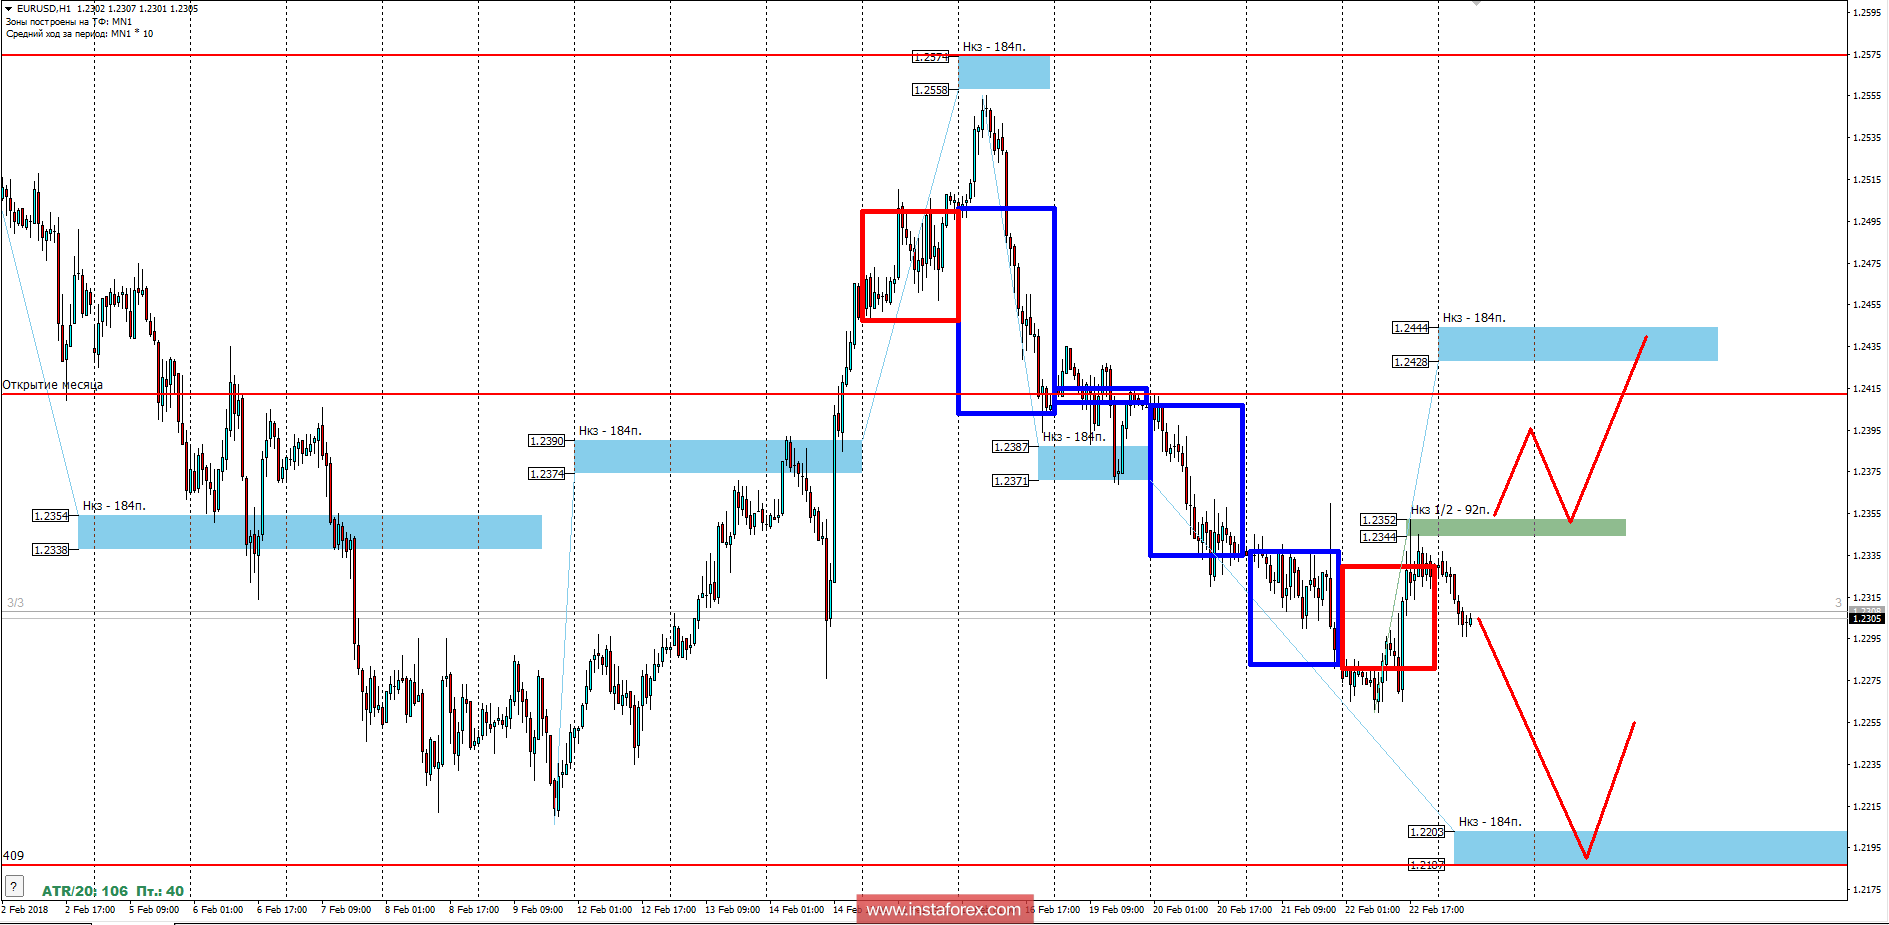
Intraday plan.
The growth path of the pair can be determined in the control zone 1/2 at 1.2352-1.2344. The test of this zone has already led to the appearance of the proposal, which indicates the continuation of the downward movement. To disrupt the downward model, it will be required to reach higher than the level of 1.2352 in the closing of today's US session at the control zone of 1.2444-1.2428. This will allow you to look for purchases. Sales, made of the resistance zone, must be held up to a weekly short-term clearance of 1.2203-1.2187, where a full fixation for the short position is required.
The daytime CP is the daytime control zone. The zone is formed by important data from the futures market.
The weekly CP is the weekly control zone. The zone is formed by marks from important futures market which change several times a year.
The monthly CP is the monthly control zone. The zone is a reflection of the average volatility over the past year.