 English
  Русский
 Bahasa Indonesia
 Bahasa Malay
 ไทย
ไทย Español
 Deutsch
 Български
 Français
 Tiếng Việt
 中文
中文 বাংলা
বাংলা हिन्दी
 Čeština
 Українська
 Română

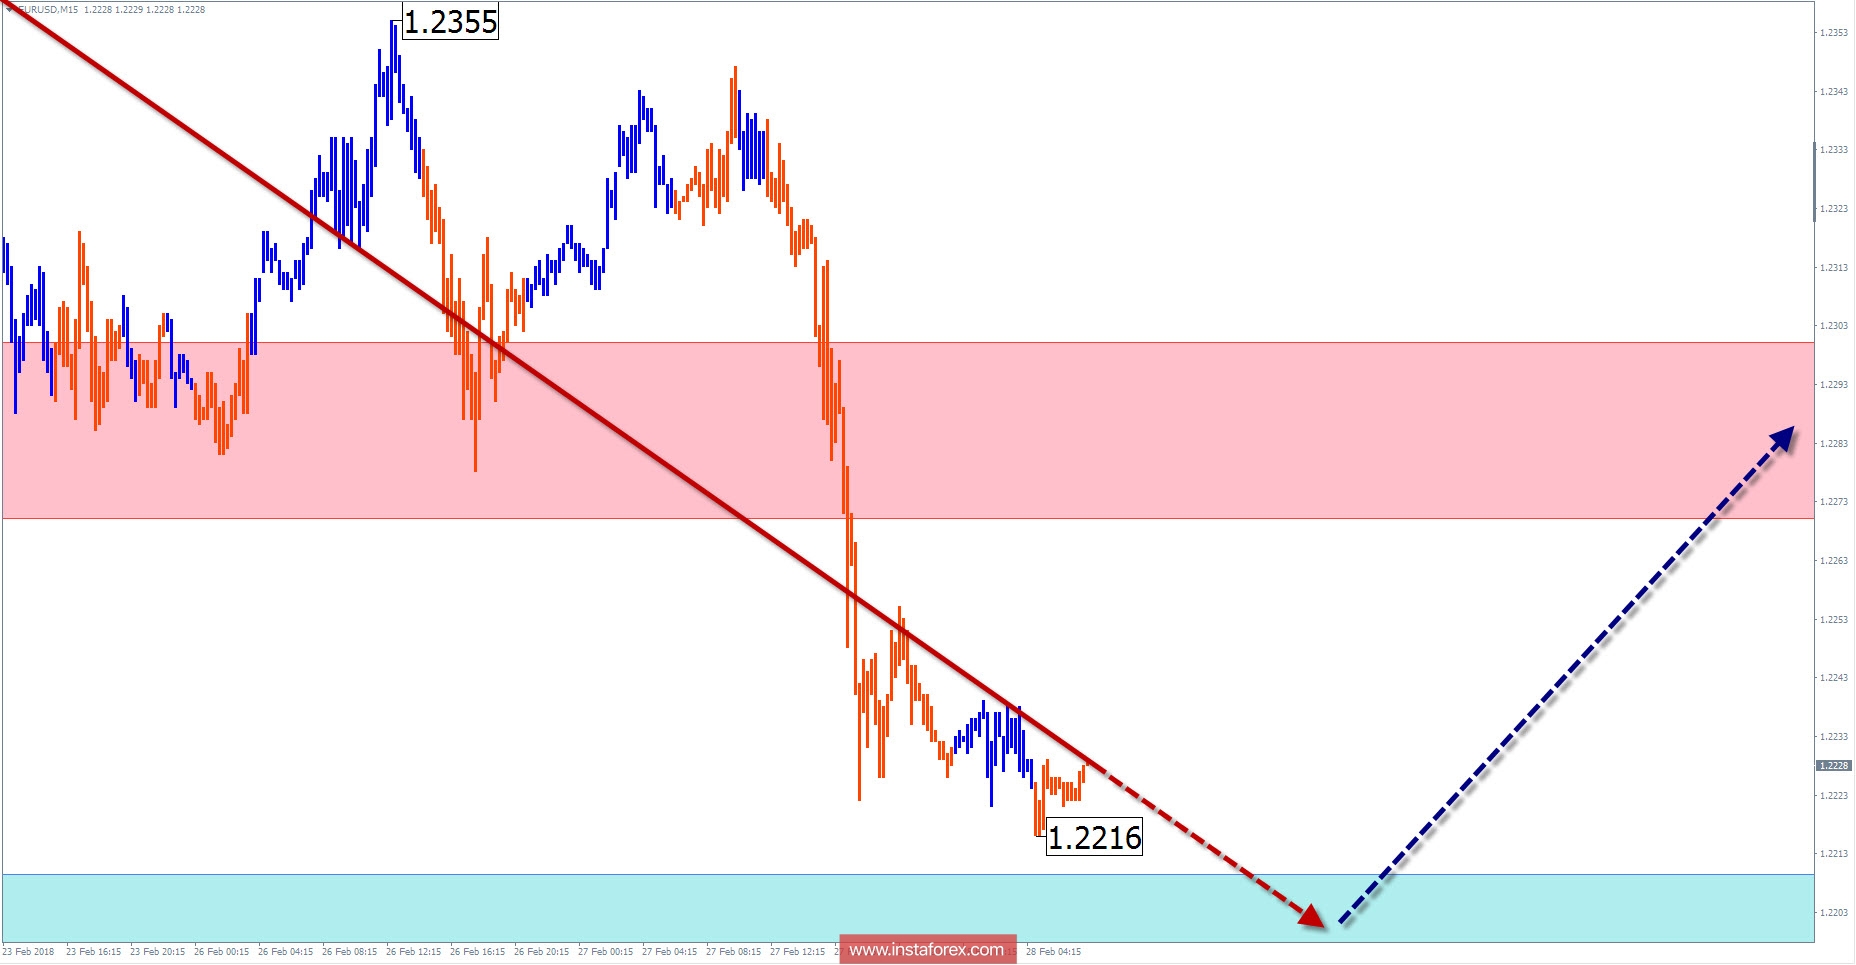
Overview and forecast for EUR / USD
The wave pattern of the euro major pair is made up of two main scales. On the weekly time frame, the direction of the trend is formed by an ascending stretched plane. The final part of the wave (C) last year moved the price of the pair upward. The structure of the whole model has not yet been completed for today, therefore, the bullish trend remains dominant.
On a younger 4-hour time frame, a short-term trend is set by a bullish wave. Being at the end of a more massive wave, it counts down from November 7 last year. Since January 25, it is developing a corrective phase. The most probable zone for its completion is located at the end of the 121st price figure.
Yesterday's decline led the price to the upper limit of a wide area potential for reversal. With a high degree of degree, we can wait for a price.
Boundaries of resistance zones:
- 1.2270 / 1.2300
Boundaries of support zones:
- 1.2210 / 1.2180
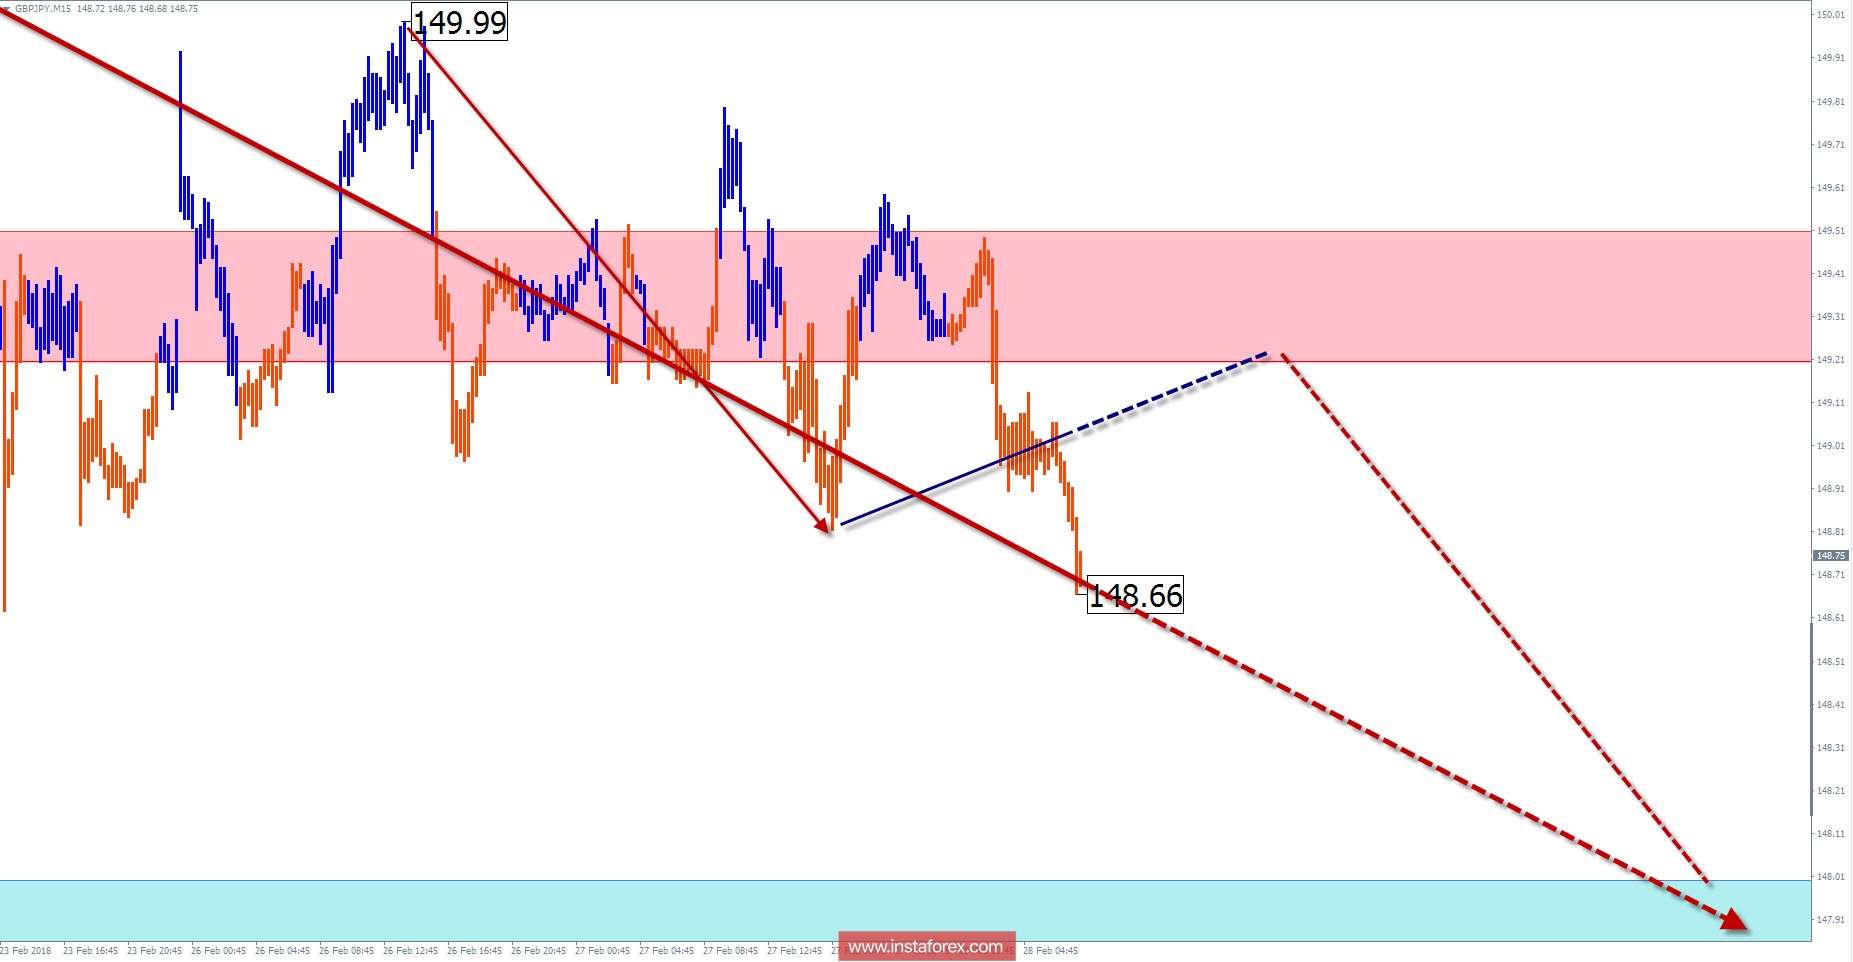
Review and Forecast for GBP / JPY
Quotations of the cross continue to move within the framework of the "rising pennant" formed over the past year and a half. The price has entered a wide zone of a potential reversal, formed around a strong level of resistance. Meanwhile, analysis of the structure of the current wave indicates its incompleteness. There is no need to change the direction of the trend.
The decline in the overall wave configuration in February took the place of the final part of the hidden correction, which is estimated to end in the lower part of the price channel.
In the coming sessions, we expect a way out of the protracted lateral flat and the price of the pair to go down. By the end of the day, the decline can take a character close to the impulse.
Boundaries of resistance zones:
- 149.20 / 50
Boundaries of support zones:
- 148.00 / 147.70
Explanations of the figures:
For simplified wave analysis, a simple waveform is used that combines 3 parts namely A, B, and C. All types of correction are created and most of the impulses can be found in these waves. Every time frame is considered and the last incomplete wave is analyzed.
The areas marked on the graphs indicate the probability of a change in the direction of motion has significantly increased as calculated in the areas. Arrows indicate the wave counting following the technique used by the author. A solid background of the arrows signifying the structure has been formed while the dotted one means the expected wave motion.
Attention: The wave algorithm does not take into account the duration of the movement of tools in time. The forecast is not a trading signal! To conduct a bargain, you need to confirm the signals used by your trading systems.