English
  Русский
 Bahasa Indonesia
 Bahasa Malay
 ไทย
ไทย Español
 Deutsch
 Български
 Français
 Tiếng Việt
 中文
中文 বাংলা
বাংলা हिन्दी
 Čeština
 Українська
 Română

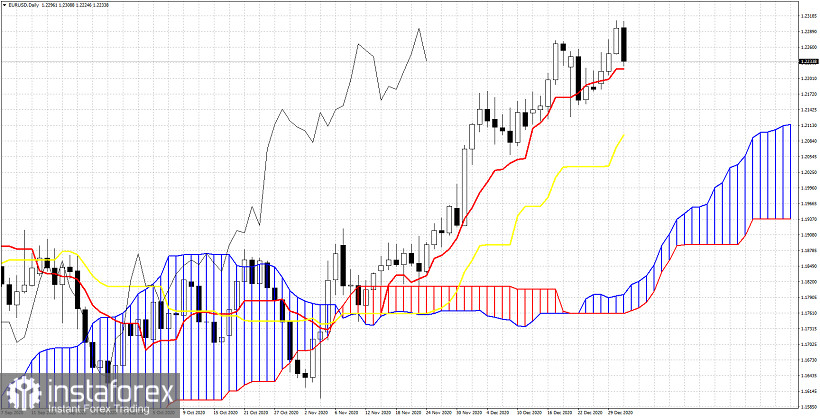
EURUSD ends the week under pressure but still at higher levels than last week. Price reached 1.2310 earlier today but sellers stepped in and pushed price lower towards 1.2230. EURUSD is under pressure but so far there is no trend reversal confirmation as price remains inside the bullish channel.
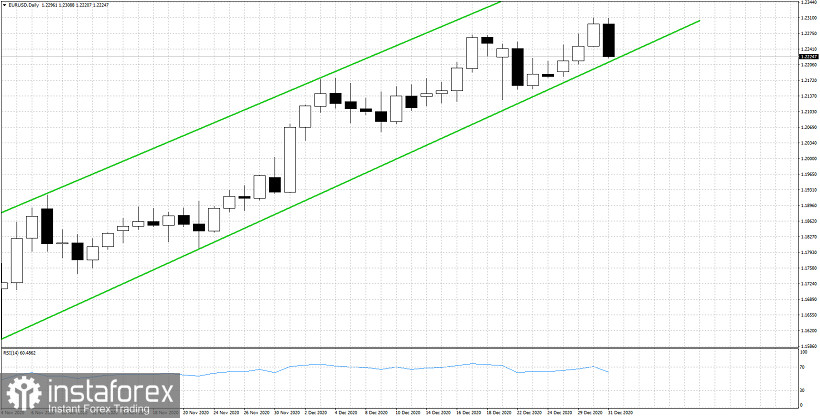
EURUSD is testing the lower channel boundary. Bulls do not want to see price break out of the bullish channel. Recent low at 1.2129 is key support level for the short-term bullish trend. Breaking below it will be a bearish sign.