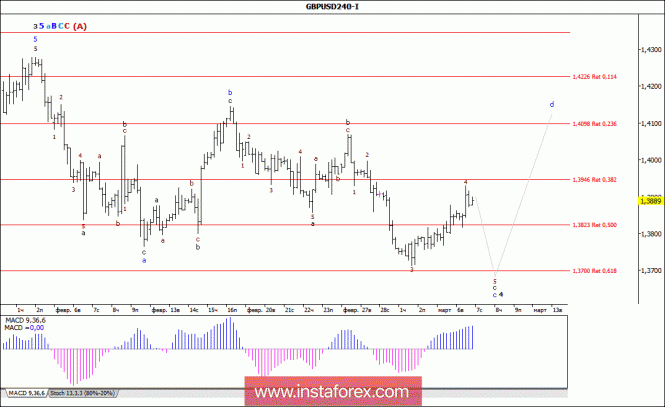
Analysis of wave counting:
Having failed to complete the turn, during the yesterday's European session, the GBP / USD currency pair started with an upward movement, adding about 100 percentage points in price and had already reached the level of 1.3930 in the middle of the day. At the same time, it can be assumed that the currency pair remained in the formation stage of the wave c, which significantly complicated its wave structure of wave c, 4, 5, a, B, C, C, (A), whose wave counting, most likely, still requires the introduction of appropriate refinements and changes. If this is the case, the currency pair may resume the decline at any time and still test the level of the 37th figure.
The objectives for building a downward wave:
1.3700 - 61.8% of Fibonacci
The objectives for building an upward wave:
1.4098 - 23.6% of Fibonacci
1.4294 - 685.4% of Fibonacci
1.4400
General conclusions and trading recommendations:
The construction of the upward trend section continues. Now, we expect a decrease in quotations with targets near the estimated mark of 1.3700, which corresponds to 61.8% of Fibonacci, within wave 4, 5, a, B, C, C, (A), which takes a rather complicated form. Within the framework of its internal wave d, the quotations from the reached minimum may begin to recede to the area of 41 figures.
 English
 Русский
 Bahasa Indonesia
 Bahasa Malay
 ไทย
ไทย Español
 Deutsch
 Български
 Français
 Tiếng Việt
 中文
中文 বাংলা
বাংলা हिन्दी
 Čeština
 Українська
 Română

