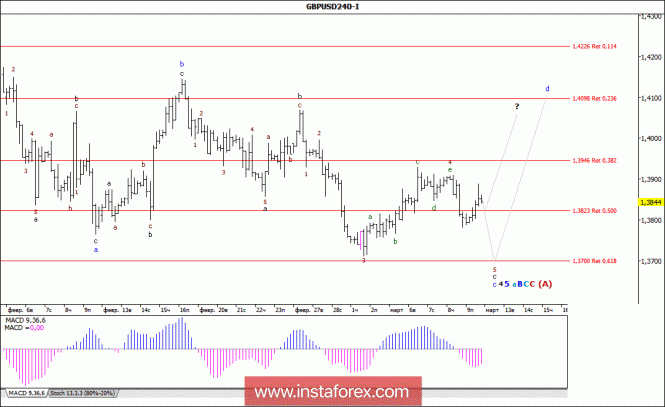
Analysis of wave counting:
On Friday, the currency pair GBP / USD trades began with a rollback from the minimum reached the previous day, having added almost 100 percentage points in price and was able to work out the mark of 1.3890 in the second half of the day. It can be assumed that the currency pair still remained in the final stage of the formation of the wave c, c, 4, 5, a, B, C, C, (A) and retained potential for testing the level of the 37th figure. At the same time, in the case of the formation of the entire wave 4, 5, a, B, C, C, (A) as a complex oblique triangle. The growth of quotations from the minimum of the first trading day of March may be the beginning of the future wave d, 4, 5, a, B, C, C, (A).
The objectives for building a downward wave:
1.3700 - 61.8% of Fibonacci
The objectives for building an upward wave:
1.4098 - 23.6% of Fibonacci
1.4294 - 685.4% of Fibonacci
1.4400
General conclusions and trading recommendations:
The construction of the upward trend section continues. Now, we expect a decrease in quotations with targets near the estimated mark of 1.3700, which corresponds to 61.8% of Fibonacci, within wave 4, 5, a, B, C, C, (A), which takes a rather complicated form. Within the framework of its internal wave d, the quotations from the reached minimum may begin to recede to the area of 41 figures.
 English
 Русский
 Bahasa Indonesia
 Bahasa Malay
 ไทย
ไทย Español
 Deutsch
 Български
 Français
 Tiếng Việt
 中文
中文 বাংলা
বাংলা हिन्दी
 Čeština
 Українська
 Română

