 English
  Русский
 Bahasa Indonesia
 Bahasa Malay
 ไทย
ไทย Español
 Deutsch
 Български
 Français
 Tiếng Việt
 中文
中文 বাংলা
বাংলা हिन्दी
 Čeština
 Українська
 Română

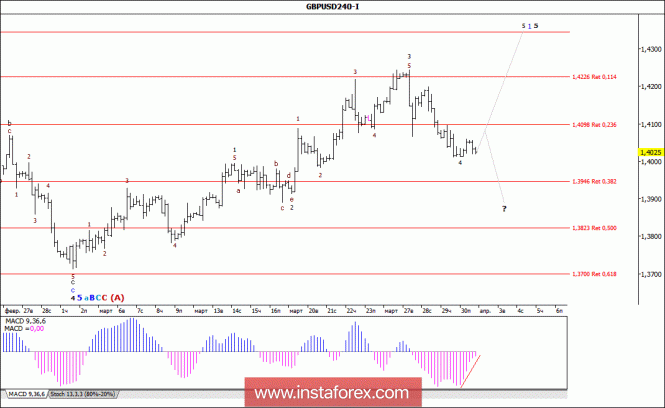
Analysis of wave counting:
In conditions of the very low trading activity, during the last day of the previous week, the GBP / USD currency pair held within the range with a maximum amplitude of price changes of about 50 percentage points. It can be assumed that the currency pair continued to make attempts to complete the formation of the wave 4, 1, 5, 5, a, B, C, C, (A). If this is the case, despite the remaining potential to lower the price to the level of 1.3900, the currency pair can resume the growth of quotations to the level of the 44th figure, thus indicating the beginning of the wave 5, 1, 5, 5, a, B, C, C, (A).
The objectives for building a downward wave:
1.3946 - 38.2% of Fibonacci
1.3823 - 50.0% of Fibonacci
The objectives for building an upward wave:
1.4226 - 11.4% of Fibonacci
1.4400
General conclusions and trading recommendations:
The construction of the upward trend section continues. Now, the resumption of the increase in quotations is expected with targets above the target level of 1.4226, which corresponds to 11.4% of Fibonacci, within the wave 5, 1, 5, 5, a, B, C, C, (A) and above, about 44 figures. As part of the construction of the corrective wave 4, the quotations continue to decline in the area of about 41 and 40 figures. If the wave continues to become more complicated, it may require adjustments to the entire wave counting.