 English
  Русский
 Bahasa Indonesia
 Bahasa Malay
 ไทย
ไทย Español
 Deutsch
 Български
 Français
 Tiếng Việt
 中文
中文 বাংলা
বাংলা हिन्दी
 Čeština
 Українська
 Română

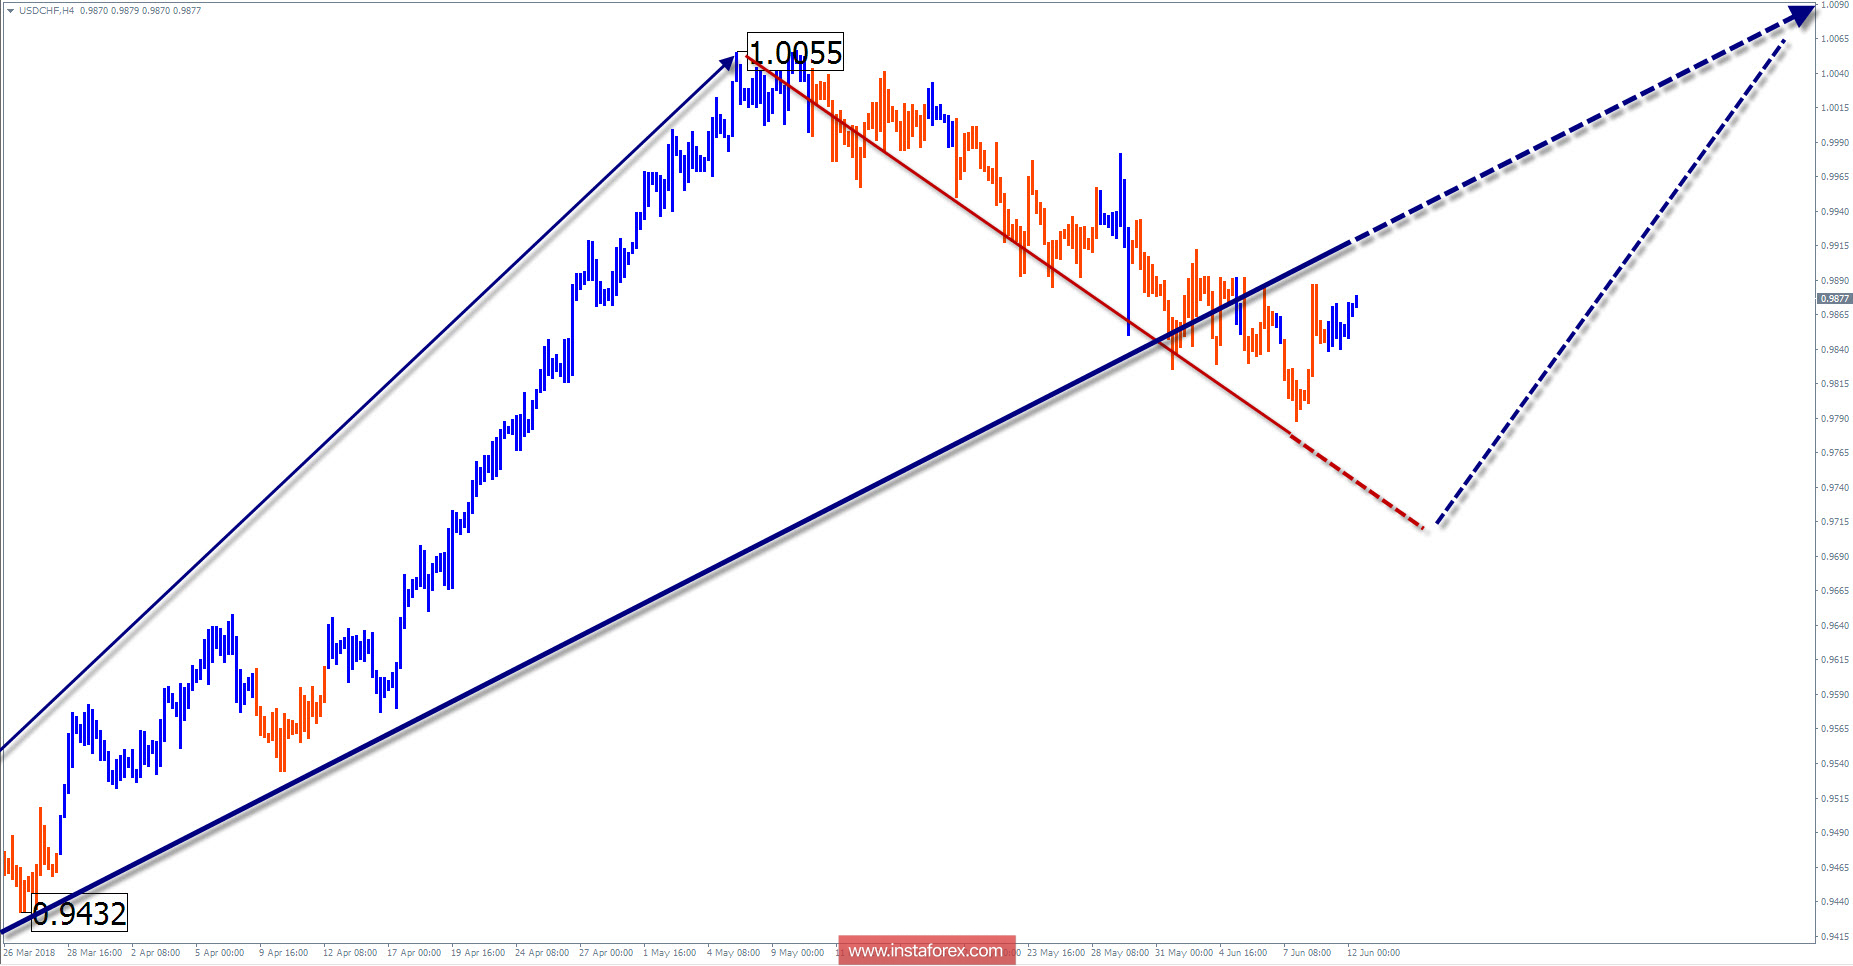
Wave picture of the chart H4:
The last wave of the instrument is ascending, from February 16. The middle part (B) is formed in the structure. The upside potential is very high.
The wave pattern of the graph H1:
The wave of May 7 is bearish. The preliminary target level is in support.

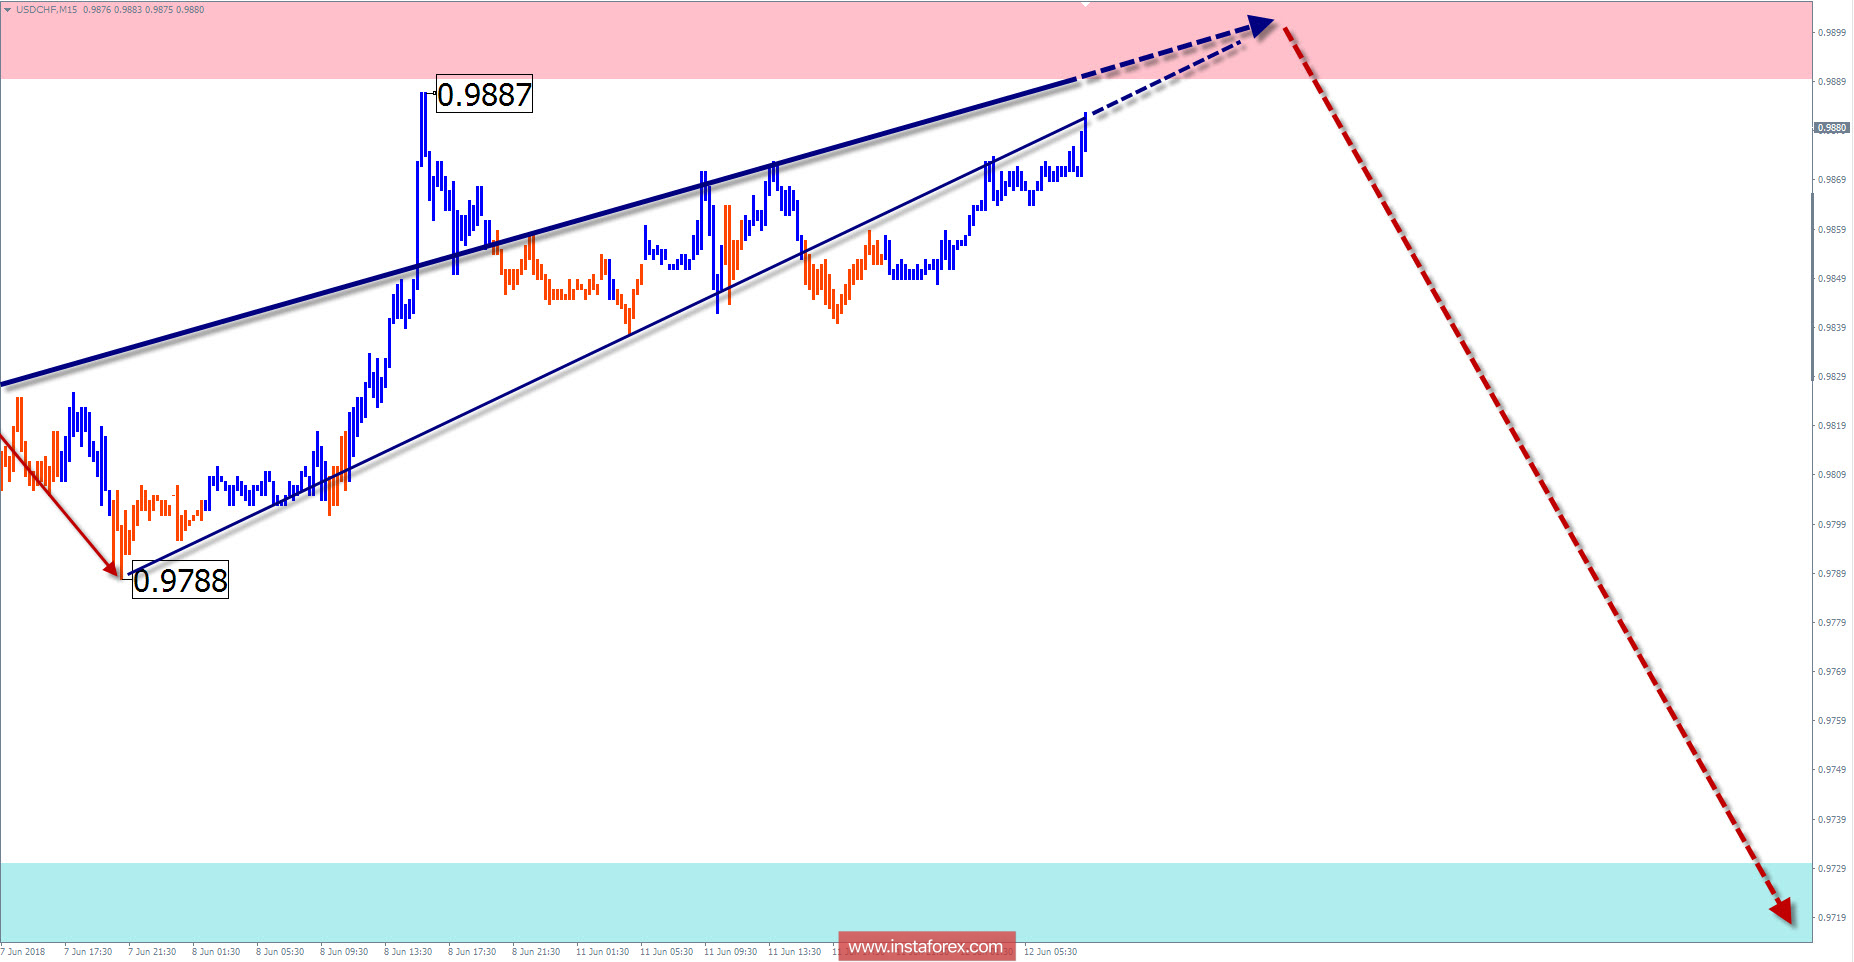
The wave pattern of the M15 chart:
Since May 29, a bullish wave is forming. It has the wrong kind of structure and limited lifting potential.
Recommended trading strategy:
Within the current week, purchases are risky. From the resistance zone, you need to look for sales signals. Trade large scale for purchases you need to wait for the completion of the entire bearish wave.
Resistance zones:
- 0.9890 / 0.9940
Support zones:
- 0.9730 / 0.9680
Explanations to the figures: In a simplified wave analysis, waves consisting of 3 parts (A-B-C) are used. For analysis, 3 main TFs are used, on each one the last, incomplete wave is analyzed. Zones show the calculated areas with the greatest probability of a turn.
Arrows indicate the wave counting according to the technique used by the author. The solid background shows the generated structure, the dotted - the expected movements.
Attention: The wave algorithm does not take into account the duration of the tool movements in time. To conduct a trade transaction, you need confirmation signals from your trading systems!