 English
  Русский
 Bahasa Indonesia
 Bahasa Malay
 ไทย
ไทย Español
 Deutsch
 Български
 Français
 Tiếng Việt
 中文
中文 বাংলা
বাংলা हिन्दी
 Čeština
 Українська
 Română

GBP / USD
The British pound on Tuesday increased by 42 points to the news that Prime Minister Theresa May decided to independently negotiate Brexit and lead the delegation of negotiators from the British side. However, at the same time, May entrusted the department with the task of working out a plan in the event of a UK exit from the EU without a deal. And although the news looks fresh, it does not inspire optimism because May has more than once failed the key moments of the talks.
The balance of production orders in the UK from the CBI in July showed a deterioration but it is better than the forecast: 11 against 13 in June and against the forecast of 8. Today, the balance of retail sales in the UK from the CBI for July is a forecast of 16 versus 32 months earlier. In the US, sales of new homes for June may also show a deterioration with a forecast of 669 thousand against 689 thousand in May.
As a result of yesterday's events, the price tested the resistance of the trend line for the second time on a four-hour chart.
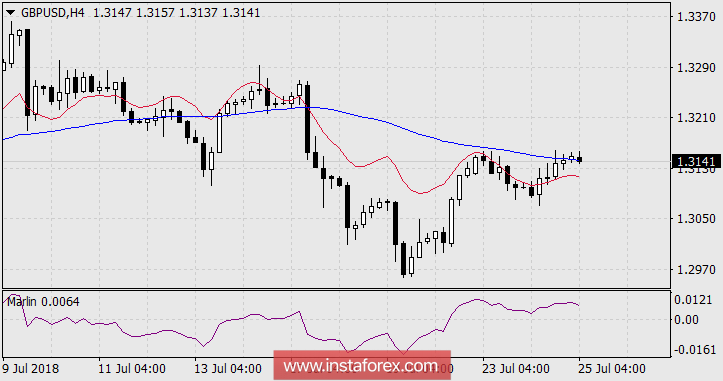
In case of further growth, the same indicator line on the daily chart at 1.3188 is the stronger resistance.
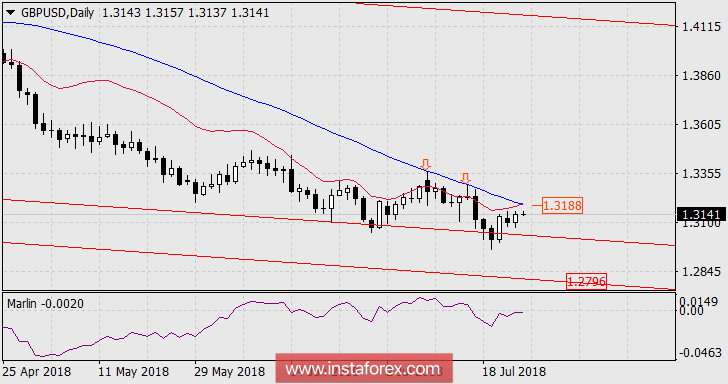
The medium-term trend remains descending. The closest goal in this direction is supporting the trend line of the price channel 1.2796.