 English
  Русский
 Bahasa Indonesia
 Bahasa Malay
 ไทย
ไทย Español
 Deutsch
 Български
 Français
 Tiếng Việt
 中文
中文 বাংলা
বাংলা हिन्दी
 Čeština
 Українська
 Română

4-hour timeframe
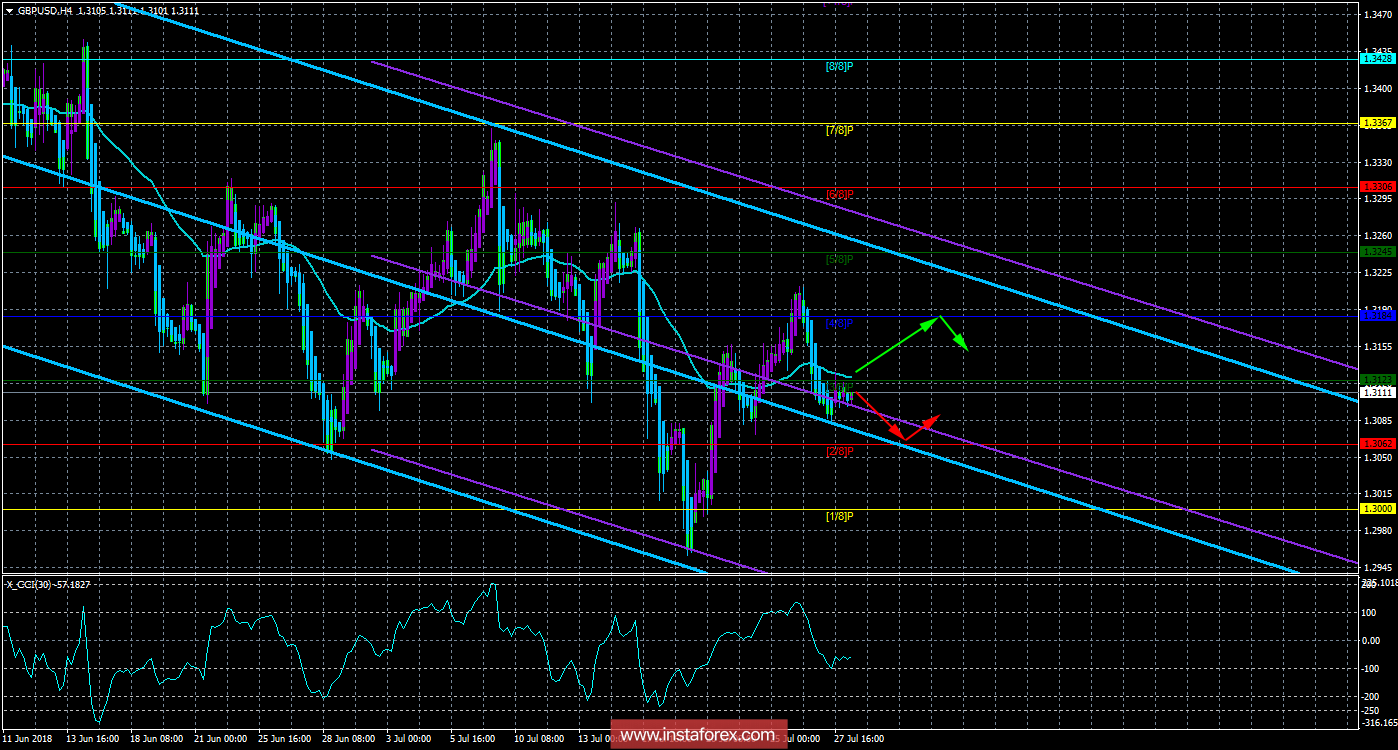
Technical data:
Higher channel of linear regression: direction - down.
The lower channel of linear regression: direction - down.
Moving average (20; flattened) - sideways.
CCI: -57.1827
On June 27, the GBP/USD currency pair almost stood at one place slightly below the moving average line. Several purple bars of the Heiken Ashi indicator alternated with blue bars, indicates a lateral correction of the instrument. There were no strong pair movements on Friday, as traders almost completely ignored US macroeconomic reports based in the EUR/USD pair review. Thus, market participants will wait for new information to open new trade transactions. This week, the meeting of the Bank of England will take place, which may raise the key rate. We believe that the British regulator will not take such a serious step now, as there are too many problems in the UK that go against the tightening of monetary policy. This is the political crisis and weak macroeconomic indicators in recent months and confusion with Brexit, which has been going on for two years. Thus, from a fundamental point of view, the initiative remains in the hands of the bears, and only Donald Trump can contribute to the British pound if he again starts fomenting trade and military conflicts in the world, as it was with the EU, China and Iran.
Nearest support levels:
S1 = 1.3062
S2 - 1,3000
S3 - 1.2939
Nearest resistance levels:
R1 = 1.3123
R2 = 1.3184
R3 = 1.3245
Trading recommendations:
For the GBP/USD pair, bears keep the initiative in their hands. Thus, short positions are currently relevant for the purpose of 1.3062. The signal to the opening of the sell-positions will be the reversal of the Heiken Ashi indicator down (1-2 bars of closed blue).
Buy-positions are recommended to be opened only after the reverse fixing of the price above the removals for the Murray level "4/8" - 1.3184. In this case, the initiative on the instrument will pass into the hands of bulls, but the trend in any case is now definitely downward.
In addition to the technical picture, one should also take into account the fundamental data and the time of their release.
Explanations for illustrations:
The upper channel of linear regression is the blue lines of unidirectional motion.
The lower channel is linear-violet lines of unidirectional motion.
CCI - the blue line in the regression window of the indicator.
Moving average (20; smoothed) - the blue line on the price chart.
Levels of Murray - multi-colored horizontal stripes.
Heiken Ashi is an indicator that color bars in blue or purple.* The presented market analysis is informative and does not constitute a guide to the transaction.