 English
  Русский
 Bahasa Indonesia
 Bahasa Malay
 ไทย
ไทย Español
 Deutsch
 Български
 Français
 Tiếng Việt
 中文
中文 বাংলা
বাংলা हिन्दी
 Čeština
 Українська
 Română

GBP / USD
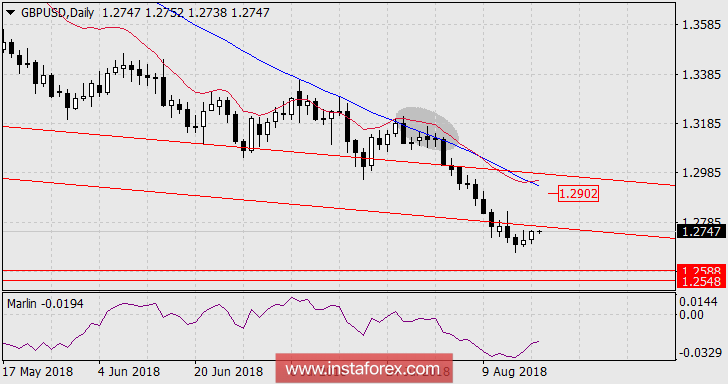
On Thursday and Friday last week, the British pound showed a moderate correction against the background of a general dollar weakening. Before the current price, a significant resistance of the downward trend developed, with about 20 points left. The breakthrough of the significant resistance may trigger a deeper growth to the resistance of the trendline (blue) to the 1.2902 area. Of course, this resistance can be overcome as it happened in the second half of July - this time is indicated in the graph with a gray oval. In this case, the upper trend red line can be worked out.
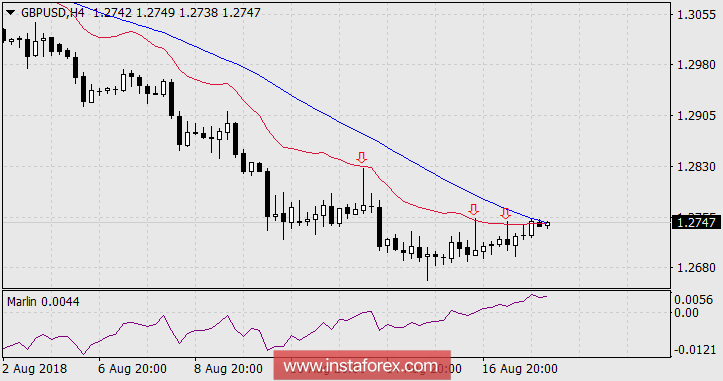
On the 4-hour chart, the criticality of the moment looks more pronounced. The price has been maintained for a long time by the balance line indicator, the price has been turned down from it three times, but now the price of the asset and both indicator lines have converged at one point. Now, further growth and a downward reversal of the price have the same probability. "Bears" are targeting the range of 1.2548 / 88, formed by the lows of June 21, 2017 and the lows of December 8, 2016.
* The presented market analysis is informative and does not constitute a guide to the transaction.