 English
  Русский
 Bahasa Indonesia
 Bahasa Malay
 ไทย
ไทย Español
 Deutsch
 Български
 Français
 Tiếng Việt
 中文
中文 বাংলা
বাংলা हिन्दी
 Čeština
 Українська
 Română

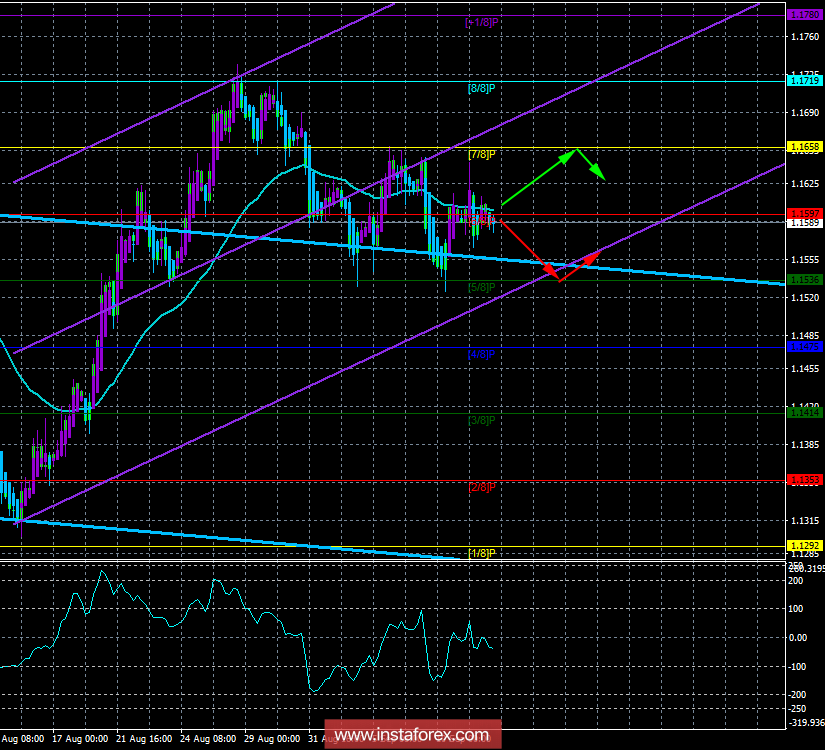
4-hour timeframe
Technical data:
The senior channel of linear regression: direction - down.
The younger channel of linear regression: the direction is up.
Moving average (20; flattened) - sideways.
СCI: -41.1377
The EUR / USD currency pair is trading near the moving average line on September 12 amid the lack of macroeconomic information and on the eve of the ECB meeting. In the last days of the news, concerning the Euro-currency, there was little, and on pure technology, the market participants are not ready to open deals now. Thus, there is only one thing. Wait for news on the topics of the trade war and the ECB meeting. ECB meeting will be held only tomorrow, and news on the topic of the trade war is unknown when they appear. Of the macroeconomic reports can be identified for today only industrial production in Europe. However, this report is unlikely to cause a surge in emotions in traders. Most likely, it will be ignored. Proceeding from this, the currency pair can spend some days in lateral movement. And even tomorrow, when the results of the meeting will be known, the picture may not change, because no serious changes in the monetary policy of the ECB is expected. Perhaps some interesting information will be announced at the press conference of the ECB, but this is also a little hope. Thus, we are preparing for flat, and technical indicators will help to identify its completion. The linear regression channels now allow both upward movement and downward movement with equal probability, and the Heikin Ashi indicator often changes direction, which is another sign of the flat.
Nearest support levels:
S1 - 1.1597
S2 - 1.1536
S3 - 1.1475
Nearest resistance levels:
R1 = 1.1658
R2 = 1.1719
R3 = 1.1780
Trading recommendations:
The EUR / USD currency pair is just below the removals, therefore, formally relevant are the sell orders with the target of 1.1536. However, now there is a high probability of flat, so any position is recommended to open with increased caution.
Long positions will become relevant above the moving average line, but the recommendations in this case are the same. Increased caution and readiness for flat. The pair can easily overcome moving and start descending movement.
In addition to the technical picture, one should also take into account the fundamental data and the time of their release.
Explanations for illustrations:
The upper channel of linear regression is the blue lines of unidirectional motion.
The lowest linear regression channel is the violet lines of unidirectional motion.
CCI - the blue line in the indicator window.
Moving average (20; smoothed) - the blue line on the price chart.
Levels of Murray - multi-colored horizontal stripes.
Heikin Ashi is an indicator that color bars in blue or purple.