 English
  Русский
 Bahasa Indonesia
 Bahasa Malay
 ไทย
ไทย Español
 Deutsch
 Български
 Français
 Tiếng Việt
 中文
中文 বাংলা
বাংলা हिन्दी
 Čeština
 Українська
 Română

Trend analysis (Fig. 1).
On Monday, the price will move downwards, with the first target – a pullback level of 50.0% - 1.2935 (blue thin line). Upon reaching this level, you can move up.
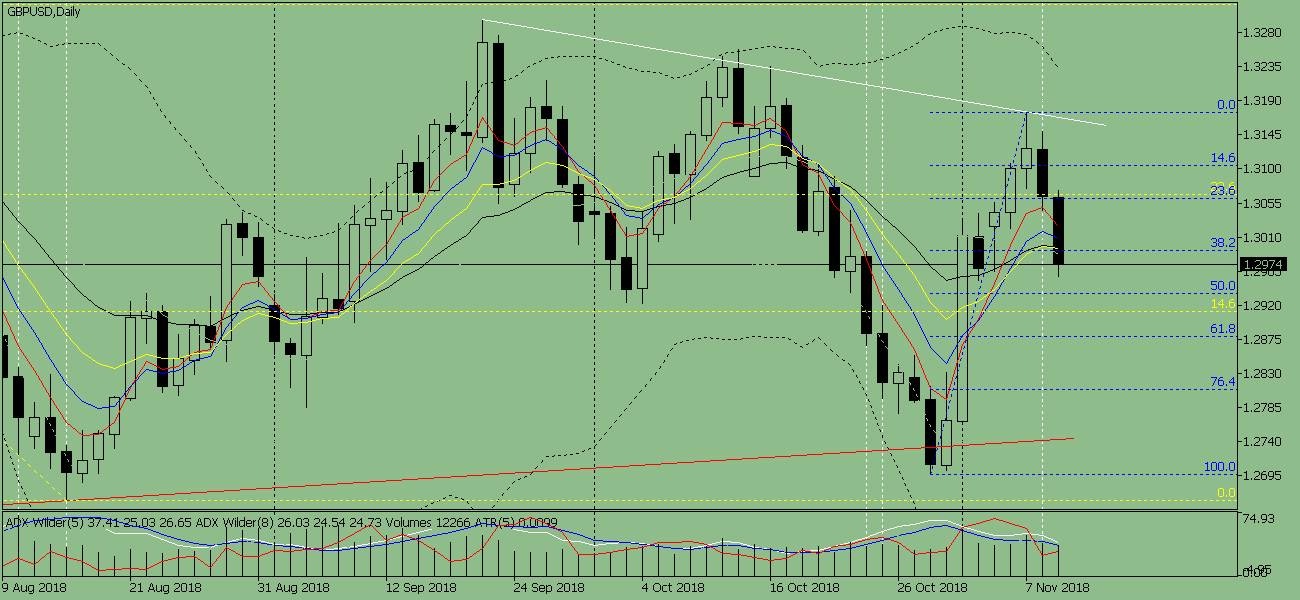
Rice. 1 (daily chart).
Comprehensive analysis:
- indicator analysis - down;
- Fibonacci levels - down;
- volumes - down;
- candlestick analysis - down;
- trend analysis - down;
- Bollinger bands - down;
- weekly chart - down.
General conclusion:
On Monday, the price will move downwards, with the first target – a pullback level of 50.0% - 1.2935 (blue dotted line). Upon reaching this level, you can move up.