 English
  Русский
 Bahasa Indonesia
 Bahasa Malay
 ไทย
ไทย Español
 Deutsch
 Български
 Français
 Tiếng Việt
 中文
中文 বাংলা
বাংলা हिन्दी
 Čeština
 Українська
 Română

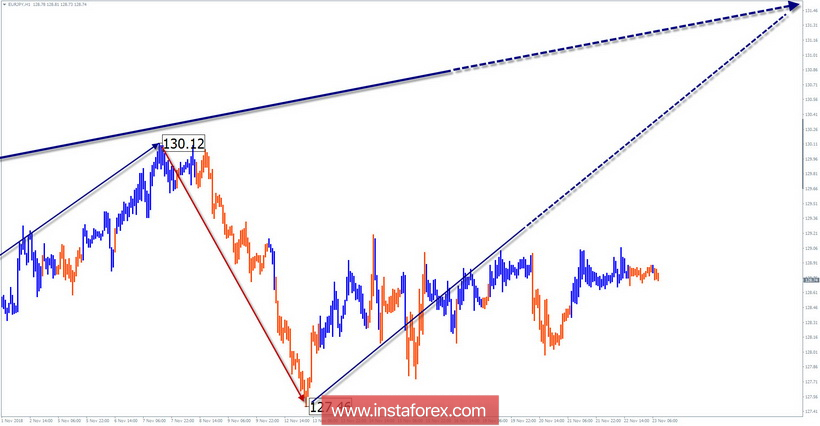
Wave pattern graphics H4:
It can be used for the short wavelength of the pair. The structure of the wave of the final part.
Wave pattern graphics H1:
The downward stretch of September 21
Wave pattern graphics M15:
From October 26, the TF. This will make it possible to move on to even larger scale of movement. Conditions for the price rise are formed in the wave.
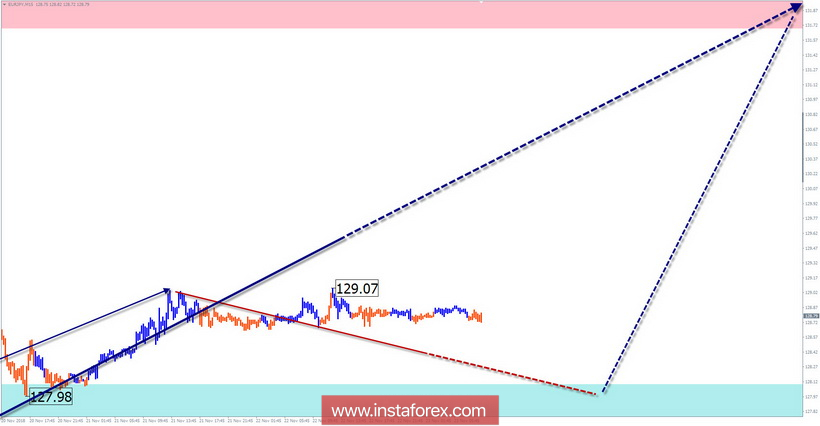
Recommended trading strategy:
If you are looking for a signal to buy an instrument.
Resistance zones:
- 131.70 / 132.20
Support areas:
- 128.10 / 127.60
Explanations to the figures: The simplified waveform analysis (A - B - C). For the analysis, the main TFs are used. Zones show calculated areas with the highest probability of reversal.
The arrows indicate the number of wave markings used by the author. The solid background shows the formed structure.
Note: The wave algorithm doesn't take into account the duration of tool movements over time. To trade a trade transaction, you need to confirm your trading systems!