 English
  Русский
 Bahasa Indonesia
 Bahasa Malay
 ไทย
ไทย Español
 Deutsch
 Български
 Français
 Tiếng Việt
 中文
中文 বাংলা
বাংলা हिन्दी
 Čeština
 Українська
 Română

Trend analysis (Fig. 1).
On Tuesday, the downward movement to 1.2462 is the support line (red bold line).
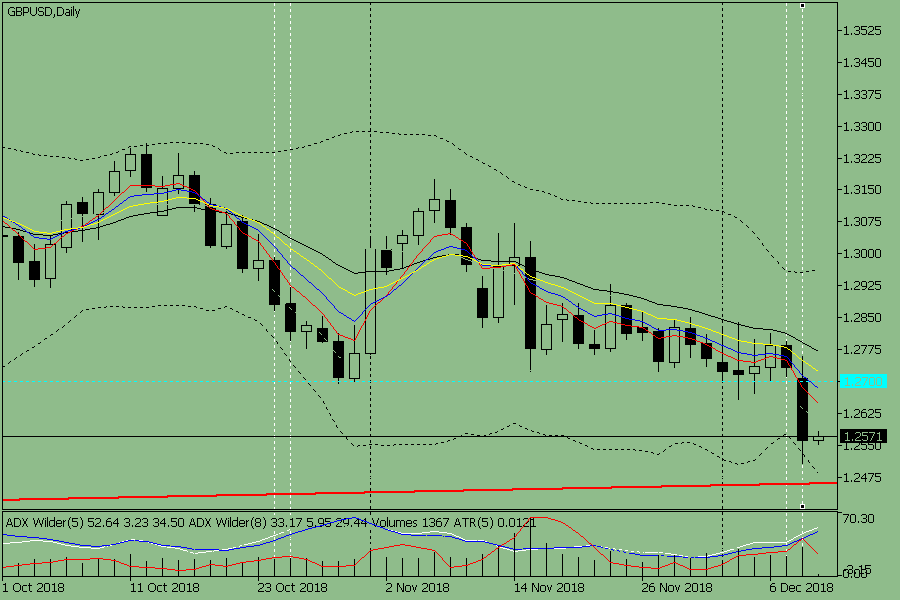
Fig. 1 (daily schedule).
Comprehensive analysis:
- indicator analysis - down;
- Fibonacci levels - neutral;
- volumes - down;
- candlestick analysis is neutral;
- trend analysis - down;
- Bollinger lines - up;
- weekly schedule - down.
General conclusion:
On Tuesday, the downward movement to 1.2462 is the support line (red bold line).