 English
  Русский
 Bahasa Indonesia
 Bahasa Malay
 ไทย
ไทย Español
 Deutsch
 Български
 Français
 Tiếng Việt
 中文
中文 বাংলা
বাংলা हिन्दी
 Čeština
 Українська
 Română

GBP/NZD
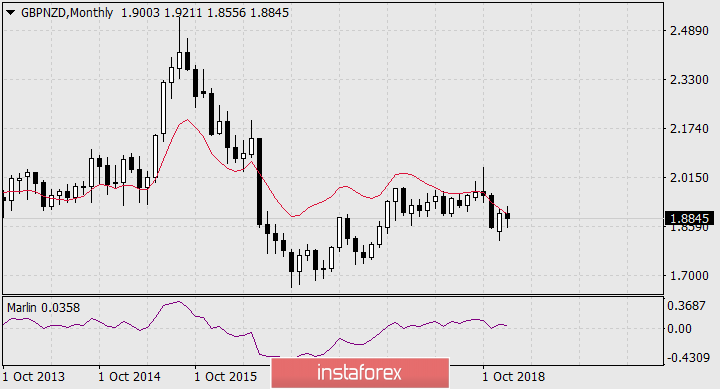
Today, January 10, there is a wonderful prospect of a mid-term decrease in the GBP/NZD pair. On the monthly chart, the price decreases from the balance line, failing to overcome it.
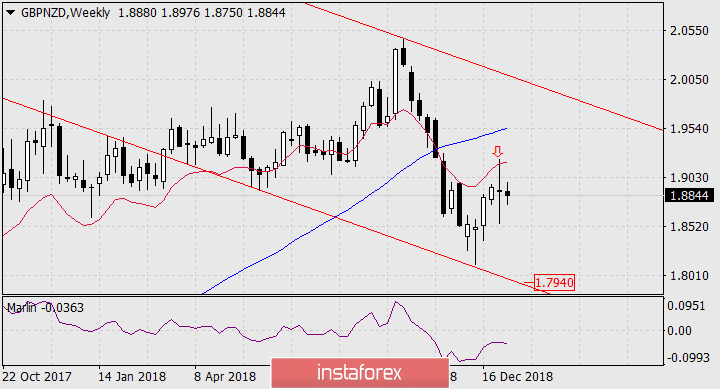
On the weekly chart, the price also moved down from the balance line last week.
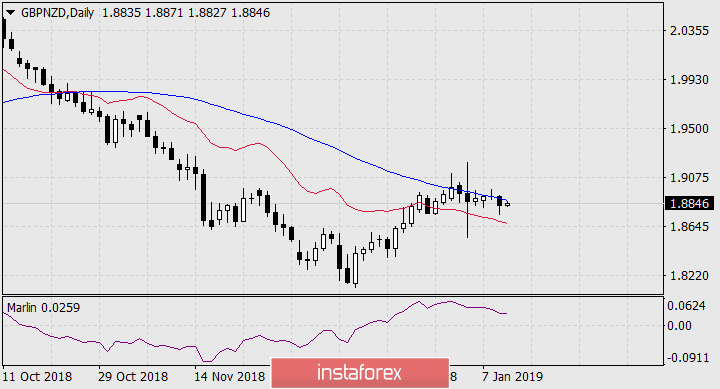
On the daily chart, the price slides down below the Krusenstern line. This is an indicator trend line; if it is down, the trend is down, and if the price crosses this line from the top down or turns down from it, the trend is also down.
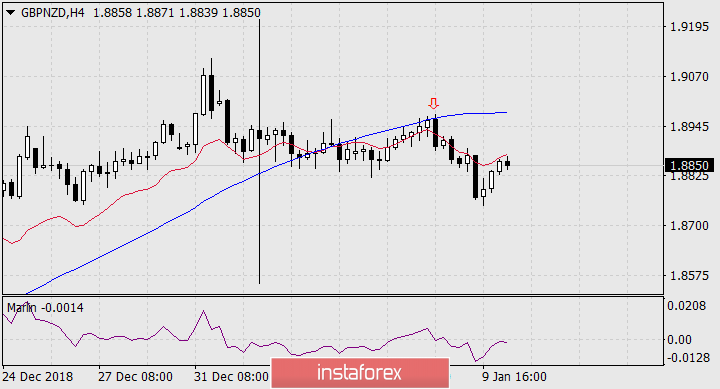
On the H4 chart, the price turned from the Krusenstern line (red arrow) downwards, then slightly corrected upwards, having worked the balance line, and currently turns from it with a black candle. Also on this timeframe, the Marlin oscillator signal line unfolds down from the border with the growth territory.
On the H1 chart, the price turns down from the combined balance and Krusenstern lines.
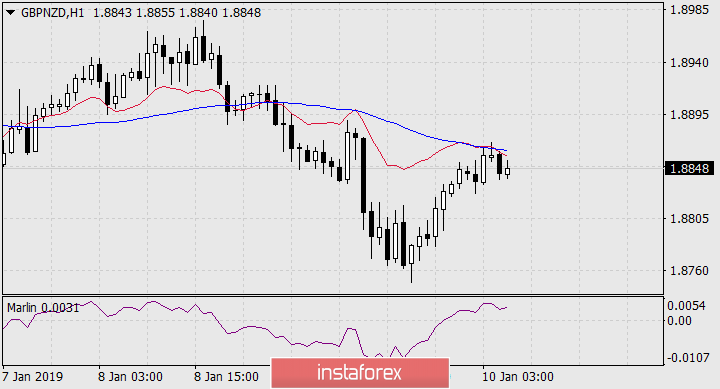
The target of the decline is to support the embedded trend line in the price channel of the weekly TF-1.7940.