 English
  Русский
 Bahasa Indonesia
 Bahasa Malay
 ไทย
ไทย Español
 Deutsch
 Български
 Français
 Tiếng Việt
 中文
中文 বাংলা
বাংলা हिन्दी
 Čeština
 Українська
 Română

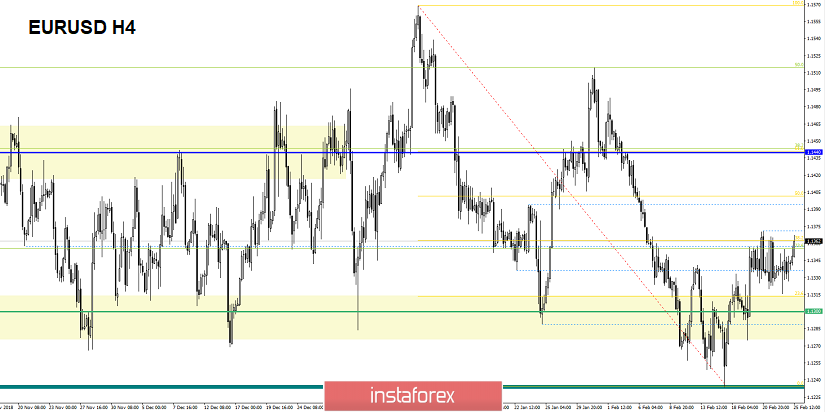
By the end of the last trading week, the euro/dollar currency pair showed low volatility of 39 points. As a result, the quotation remained within the previously formed cluster. From the point of view of technical analysis, in principle, nothing has changed. The accumulation of 1.1320 / 1.1370 remains in the market, where the quotation consistently fulfills the boundaries. The news background is moderately developed in the stream of statements on Brexit. The nearest voting in the British Parliament regarding the agreement, or the so-called "Plan B", has been postponed to a longer term, presumably until March 12. At the same time, the British government is fully considering the possibility of postponing the country's withdrawal from the EU for 2 months. In Europe itself, they are already thinking about transferring Brexit to the year 2021.
Today, the economic calendar is empty. Traders, in turn, are waiting for tomorrow's speech by the head of the Federal Reserve System, Mr. Powell.
Further development
Analyzing the current trading chart, we see that the quotation closely approached the upper boundary of the cluster of 1.1370, developing just at Fibo levels of 23.6 and 38.2. There is certainly potential for growth, but it's still too early to lay long positions. Yet the price is within the cluster and, possibly, will continue the ambiguous talker. In turn, traders will analyze the boundaries of the cluster for fixations. At the same time, they will also calculate possible pending orders.
Based on the available data, it is possible to decompose a number of variations, let's consider them:
- We consider buying positions in the case of price fixing higher than 1.1375 with the prospect of a move to 1.1400-1.1440.
- Positions for sale are considered in the case of price fixing lower than 1.1320 (not punctured by shadow). Perspective 1.1300 - 1.2880 --- 1.1250.
Analyzing a different sector of timeframes (TF ), we can see that in the short, there is an upward interest in the intraday and medium term. However, since the quotation is still within the boundaries of the 1.1320 / 1.1370 cluster, the indicators for smaller TFs can vary arbitrarily.

Weekly volatility / Measurement of volatility: Month; Quarter; Year
The measurement of volatility reflects the average daily fluctuation with the calculation for the Month / Quarter / Year.
(February 25 was based on the time of publication of the article)
The current time volatility is 40 points. In the case of maintaining the current amplitude fluctuations, the volatility will remain low. However, in the case of the breakdown of a particular boundary (1.1320 / 1.1370), a splash is shown which might lead to high volatility.

Key levels
Zones of resistance: 1.1440; 1.1550; 1.1650 *; 1.1720 **; 1.1850 **; 1.2100
Support areas: 1.1340 *; 1,1300 **; 1.1214 **; 1.1120; 1.1000
* Periodic level
** Range Level