 English
  Русский
 Bahasa Indonesia
 Bahasa Malay
 ไทย
ไทย Español
 Deutsch
 Български
 Français
 Tiếng Việt
 中文
中文 বাংলা
বাংলা हिन्दी
 Čeština
 Українська
 Română

EUR/USD
On Thursday, the euro lost 26 points, reaching the low of November last year and closing the trading session just below the target level of 1.1234. On the daily chart, the price is firmly fixed below the indicator lines of balance (indicator red) and MACD (indicator blue), the signal line of the Marlin oscillator is developing in the decline zone.
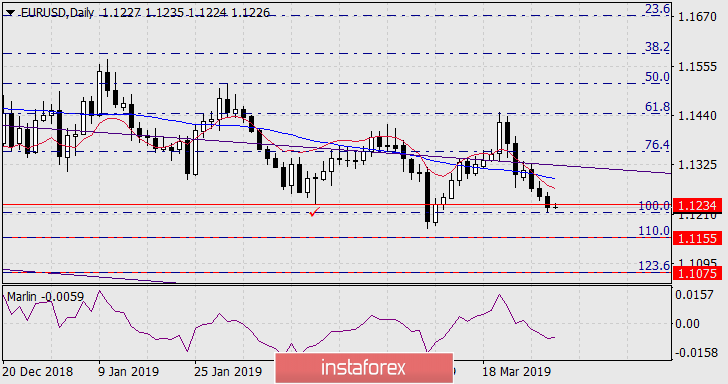

On the four-hour chart, the price is going with the forces below the level of 1.1234 (the low of 15 February), the signs of all indicators signify the prospect of the euro's further decline. The first goal of the decline is the Fibonacci reaction level of 110.0% at the price of 1.1155, the second target of 1.1075 is the Fibonacci level of 123.6%. Basic branch while constructing Fibonacci retracement from 24 September to 12 November.