 English
  Русский
 Bahasa Indonesia
 Bahasa Malay
 ไทย
ไทย Español
 Deutsch
 Български
 Français
 Tiếng Việt
 中文
中文 বাংলা
বাংলা हिन्दी
 Čeština
 Українська
 Română

The euro/dollar currency pair for the last trading day again showed low volatility of 41 points, but at the same time, traders received the first signal of the end of the correction. From the point of view of technical analysis, we see that the average daily volatility remains at a low level already as for the 9th trading day in a row. At the same time, the cluster that we could observe yesterday at 1.1230 / 1.1255 fell, breaking through the lower boundary and giving a possible signal of the end of the corrective phase. The news and news background did not have any statistics in it, and the market tritely chewed on earlier statements by the Head of the European Commission, Jean-Claude Juncker, where he made it clear that Britain had April 12 deadline for approving the agreement, otherwise exit without a deal and without any additional delay.
In turn, Greek Prime Minister Alexis Tsipras said; this morning began with news from England, where Prime Minister Teresa Mae, without giving up, sent a letter to the head of the European Council, Donald Tusk, asking him to postpone Brexit's date to 30 June.
"I inform the European Union that the UK is requesting another postponement of the date of Brexit. Britain proposes to complete the process (exit from the EU) on June 30, 2019 ...
Donald Tusk's response was not long in coming, he considers it possible to offer Britain a "flexible" 12-month delay when leaving the European Union. The idea of Tusk will be the subject of discussion at an emergency summit of EU leaders on April 10.
I understand everything, of course. Theresa May no longer has a way out, and these meaningless letters serve only to show imitation of hectic activity, but what about Donald Tusk? His response was constructed in such a way that it is not entirely clear whether Britain is obliged to accept the agreement before April 12. And, of course, we should not forget about the earlier statement of the Head of the European Commission Jean-Claude Juncker, who said everything clearly.
Returning back to the plans of the current day, we see that important statistics from the United States are being published today regarding Non Farm Payrolls data, where a significant increase is expected from 20K to 180K. On this news, speculators are already predicting a dollar strengthening, which is what we expect.
The upcoming trading week expects to be energetic both in terms of statistical data and on the information background, where the fate of long-playing Brexit will be decided. Displayed below are the most relevant events of the week.
Monday
United States 17:00 MSK - Volume of industrial orders (m / m) (Feb): Prev. 0.1% ---> Forecast -0.5%
Tuesday
United States 17:00 MSK - Number of vacancies in the labor market JOLTS (Feb): Prev. 7.581M ---> Forecast 7.540M
Wednesday
15:30 Moscow time - ECB meeting, with a subsequent press conference
United States 15:30 MSK - Consumer Price Index (CPI) (y / y) (Mar): Prev. 1.5% ---> Forecast 1.8%
United States 21:00 MSK - Publication of FOMC protocols
Meeting of the European Council, where there will be a discussion regarding Brexit.
Thursday
United States 15:30 MSK - Producer Price Index (PPI) (y / y) (Mar): Prev. 1.9%
Friday
Brexit Key Day
These are preliminary and subject to change.
Further development
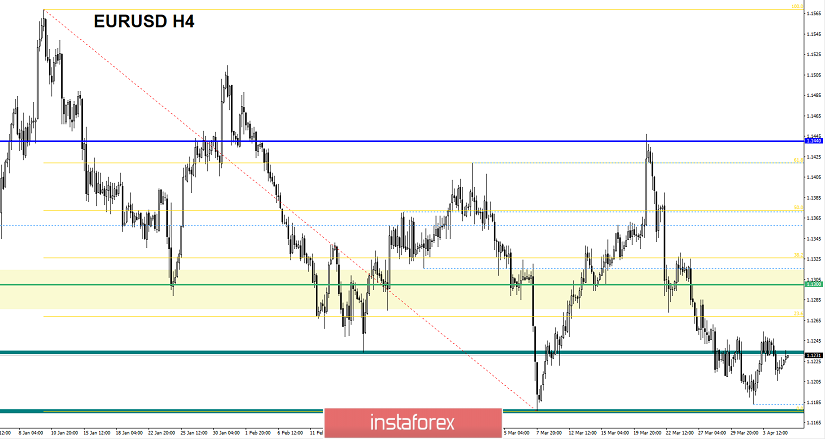
Analyzing the current trading chart, we see a slight pullback to the previously broken 1.1230 cluster, where the quotation feels resistance, temporarily slowing down. It is likely to assume that this value is in effect to play the role of resistance, together with statistical data on Non Farm USA, we can see the recovery of short positions and the move towards the level of 1.1180. Due to the safety net, traders consider the value of 1.1260 in the form of long positions, in case everything changes at the last moment.
Based on the available data, it is possible to decompose a number of variations, let's consider them:
- Buy positions are considered by traders in the event of a price fixing higher than 1.1260 (not a puncture).
- Traders considered selling positions yesterday from a value of 1.1225, towards 1.1180. If you do not have deals, then, in principle, you can insure yourself and put an order below yesterday's minimum of 1.1205, the prospect is the same.
Indicator Analysis
Analyzing a different sector of timeframes (TF ), we see that in the short and intraday perspective there is an upward interest against the background of a rollback and a recent correction. The medium-term perspective maintains the downward interest in the market.

Weekly volatility / Measurement of volatility: Month; Quarter; Year
Measurement of volatility reflects the average daily fluctuation , with the calculation for the Month / Quarter / Year.
(April 5 was based on the time of publication of the article)
The current time volatility is 19 points. It is likely to assume that, against the background of data on Non Farm, volatility may increase, but it is not yet the fact considering that the average daily volatility values will be broken.

Key levels
Zones of resistance: 1.1300 **; 1.1440; 1.1550; 1.1650 *; 1.1720 **; 1.1850 **; 1.2100
Support areas: 1.1180; 1.1000
* Periodic level
** Range Level