 English
  Русский
 Bahasa Indonesia
 Bahasa Malay
 ไทย
ไทย Español
 Deutsch
 Български
 Français
 Tiếng Việt
 中文
中文 বাংলা
বাংলা हिन्दी
 Čeština
 Українська
 Română

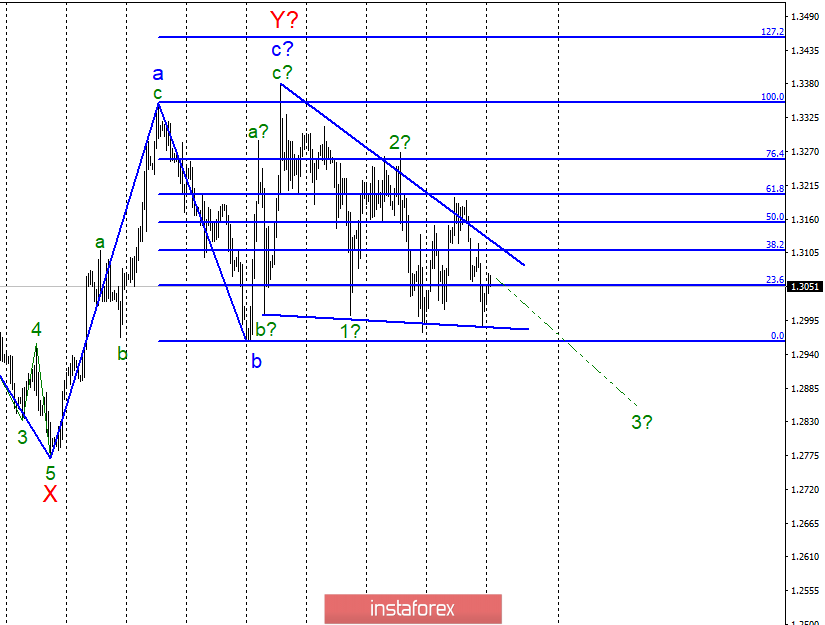
Wave counting analysis:
On April 5, the GBP / USD pair lost about 40 bp. However, there was a failed attempt to break through the lower line forming a tapering triangle. Thus, the tool remains clamped in the specified triangle and we just have to wait for it to leave. Based on the current wave counting, we can expect further construction of a downtrend trend, but the overall uncertainty on the Brexit makes the markets cautious. Thus, I recommend waiting for new messages on Brexit and waiting for the triangle to go beyond.
Purchase goals:
1.3350 - 100.0% Fibonacci
1.3454 - 127.2% Fibonacci
Sales targets:
1.2961 - 0.0% Fibonacci
General conclusions and trading recommendations:
Wave pattern involves the construction of a downward trend. However, trades will take place inside it until the pair breaks through one of the lines of the triangle. This also limits the markets of the possibility to open various medium-term and long-term deals. The break through of one of the lines of the triangle will be a strong enough signal to buy or sell.