 English
  Русский
 Bahasa Indonesia
 Bahasa Malay
 ไทย
ไทย Español
 Deutsch
 Български
 Français
 Tiếng Việt
 中文
中文 বাংলা
বাংলা हिन्दी
 Čeština
 Українська
 Română

4-hour timeframe
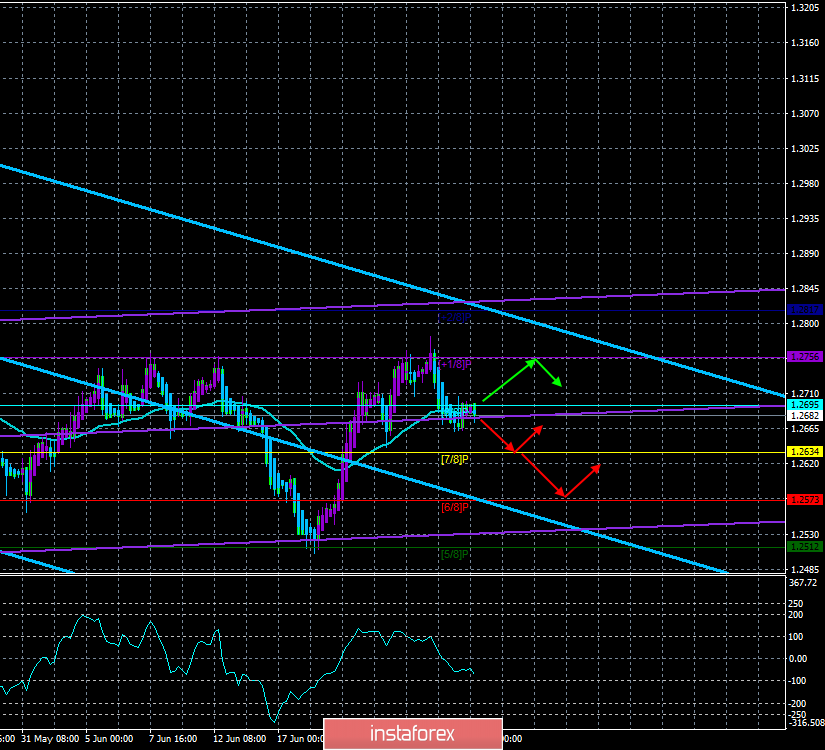
Technical data:
The upper linear regression channel: direction – down.
The lower linear regression channel: direction – up.
The moving average (20; smoothed) – sideways.
CCI: -73.7323
It seems that hard times are coming again for the pound sterling. Hopes for new negotiations between the EU and the UK are melting away, and hopes for an orderly Brexit. But the "hard" Brexit is becoming more likely, which is supported by both candidates for the premiere. The European Union officially announced that it refuses any new negotiations on the terms of the "deal" and is preparing for a "hard" scenario. The British pound, which rose by 2.5 cents with great difficulty, now has all the chances to slide back to the level of 1.2500, and possibly lower. So far, traders from new sales of the British currency keeps permanently negative macroeconomic statistics from overseas. However, it seems that the bears are still ready for new sales of the pound/dollar pair, despite the nature of news from the States. Now, the pair has fixed a little below the MA, keeping the chances of resuming the upward movement. But much more likely to resume the downward trend. This can be seen even from the technical picture. There are no planned publications in the UK today, but most likely, reports on Brexit and the election of the Prime Minister will continue to arrive.
Nearest support levels:
S1 – 1.2634
S2 – 1.2573
S3 – 1.2512
Nearest resistance levels:
R1 – 1.2695
R2 – 1.2756
R3 – 1.2817
Trading recommendations:
The GBP/USD pair failed to overcome the level of 1.2756, which led to a consolidation below the moving average. We recommend a cautious sale of the pound sterling with a target of 1.2634, as the bears have not yet confirmed their intention to a new campaign to the south.
It will be possible to buy the pound/dollar pair in small lots with targets at 1.2756 and 1.2817 after the price is fixed back above the moving average. In this case, the bulls will receive a new opportunity to form an upward trend.
In addition to the technical picture should also take into account the fundamental data and the time of their release.
Explanation of illustrations:
The upper linear regression channel – the blue line of the unidirectional movement.
The lower linear regression channel – the purple line of the unidirectional movement.
CCI – the blue line in the indicator regression window.
The moving average (20; smoothed) is the blue line on the price chart.
Murray levels – multi-colored horizontal stripes.
Heiken Ashi is an indicator that colors bars in blue or purple.