English
  Русский
 Bahasa Indonesia
 Bahasa Malay
 ไทย
ไทย Español
 Deutsch
 Български
 Français
 Tiếng Việt
 中文
中文 বাংলা
বাংলা हिन्दी
 Čeština
 Українська
 Română

Oil (CL)
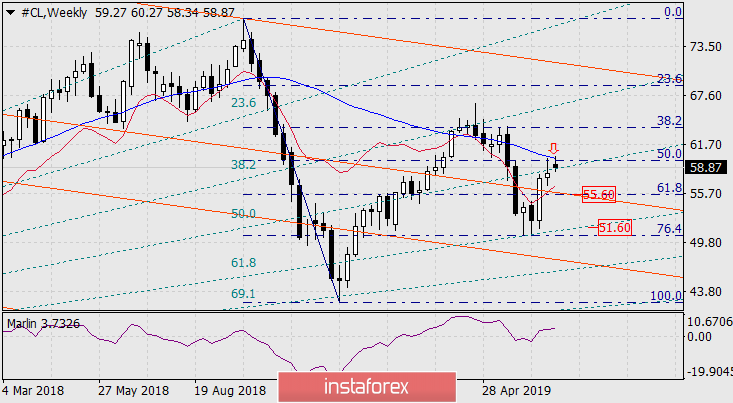
On the weekly scale chart, oil has reversed from the point of intersection of the Fibonacci retracement level of 50.0% with the MACD indicator line, which is a dynamic trend line. Smaller scale charts will be considered to confirm the reversal but here, we will also highlight the reduction target of 55.60. The intersection point of the Fibonacci level 61.8%, which is 38.2% of the correction from the entire decline part in 2018. The grid is expanded to identify long-term goals below the level of 100.0% and the enclosed line of the decreasing price channel. The second target is the Fibonacci extension of 61.8% at 51.60 that started at least in 2016.
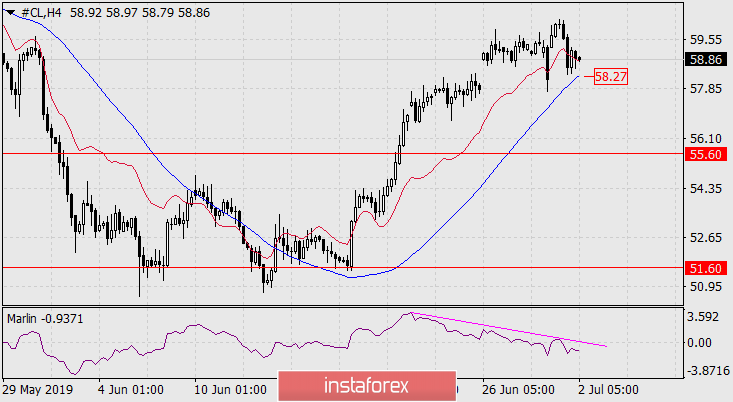
On the daily chart, an obvious reversal is not visible but the price is developing below the MACD line. the line itself is directed downwards, indicating a downward main trend. The Marlin oscillator signal line has slowed in growth and is visually ready for a reversal.

On the four-hour chart, the reversal signal in Marlin is firmly fixed with almost double divergence and a signal line in the zone of negative numbers. With the exit of the price under the MACD line (58.27), a signal will be formed to open short positions.