 English
  Русский
 Bahasa Indonesia
 Bahasa Malay
 ไทย
ไทย Español
 Deutsch
 Български
 Français
 Tiếng Việt
 中文
中文 বাংলা
বাংলা हिन्दी
 Čeština
 Українська
 Română

4-hour timeframe
The amplitude of the last 5 days (high-low): 64p - 43p - 25p - 107p - 40p.
Average amplitude for the last 5 days: 56p (63p).
If the euro declined by 10-15 points and not more during the day then the British currency fell by 60. It is even difficult to say why the pound sterling fell today. Because of Powell's upcoming speeches? Due to the sheer political confusion in the UK, in which Johnson, who has not yet become the prime minister, threatens the EU with a hard Brexit, Jeremy Corbyn calls on the new prime minister to consider the issue of a repeated referendum, speaks out that his party does not support any of the options for Brexit on a future vote, and Jeremy Hunt, another candidate for prime minister, accuses Corbyn of saying that "he never believed in the UK"? Or does the pound become cheaper simply by inertia? Any of these options are possible, and all of them together could give an effect similar to that of today. If we add here the technically important overcoming of the previous local low, it becomes clear that the chances that the pound will grow remain extremely small. In order for these chances to increase, we need positive information for the pound and this can only come from the United States. Either in the form of new failed macroeconomic reports, or from Jerome Powell, who will have important speeches today, tomorrow and the day after tomorrow. So it turns out that any negative information from the US does not offset the problems of the UK, but will only distract the attention of traders from them for a while. That is, if the pound sterling becomes more expensive then it would not be much or stay for too long.
Trading recommendations:
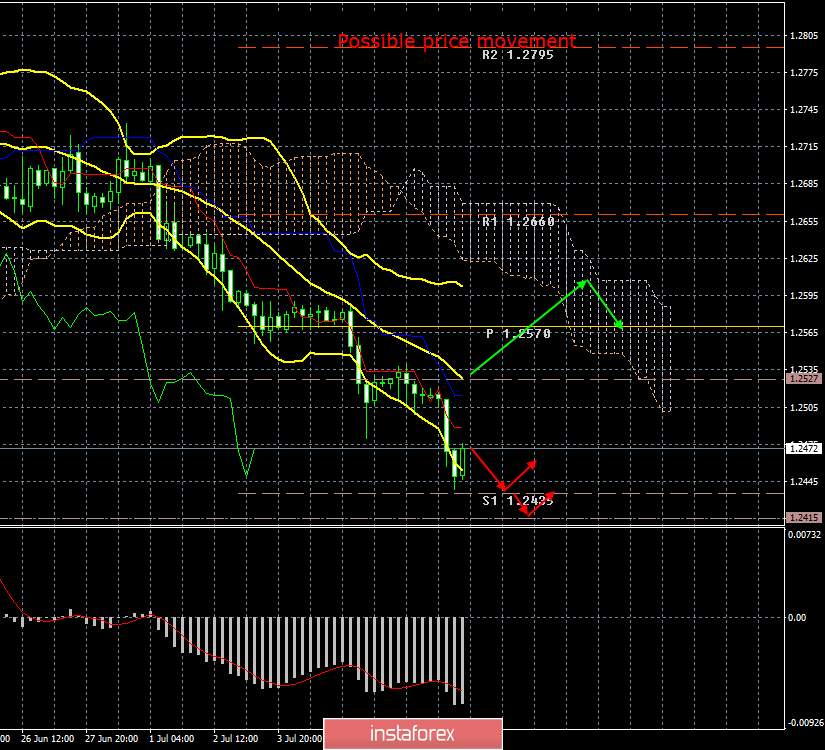
The pound/dollar currency pair resumed its downward movement. Thus, traders are advised to re-sell the pound sterling with targets at 1.2435 and 1.2415.
It will be possible to buy the British currency no earlier than when the pair consolidates above the critical line. In this case, the bulls will get a small chance to form an upward trend.
In addition to the technical picture should also take into account the fundamental data and the time of their release.
Explanation of the illustration:
Ichimoku indicator:
Tenkan-sen - the red line.
Kijun-sen - the blue line.
Senkou Span A - light brown dotted line.
Senkou Span B - light purple dotted line.
Chikou Span - green line.
Bollinger Bands indicator:
3 yellow lines.
MACD Indicator:
Red line and histogram with white bars in the indicator window.