 English
  Русский
 Bahasa Indonesia
 Bahasa Malay
 ไทย
ไทย Español
 Deutsch
 Български
 Français
 Tiếng Việt
 中文
中文 বাংলা
বাংলা हिन्दी
 Čeština
 Українська
 Română

Trend analysis.
In the coming week, the price will move up with the first target - 1.2661, a pullback level of 23.6% (yellow dotted line).
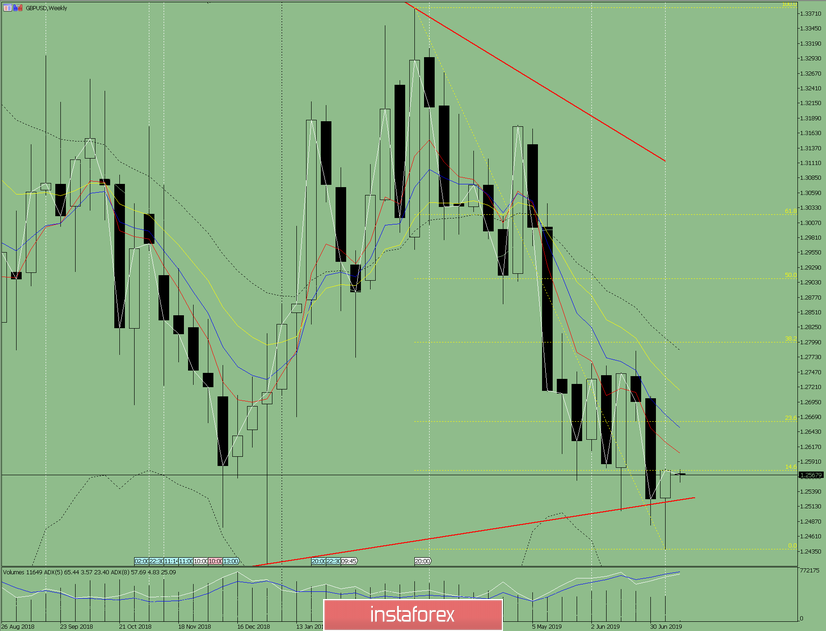
Fig. 1 (weekly chart).
Complex analysis:
- Indicator analysis – down;
- Fibonacci levels – up;
- Volumes – up;
- Candle analysis – neutral;
- Trend analysis – up;
- Bollinger bands – down;
- Monthly schedule – down.
The conclusion from the complex analysis is the upward movement.
The overall result of the calculation of the GBP/ USD currency pair candle on the weekly chart: the price for weeks is likely to have an upward trend with the presence of the first lower shadow of the weekly white candle (Monday – down) and the absence of the second upper shadow (Friday – up).
The price will move up with the first target - 1.2661, a pullback level of 23.6% (yellow dotted line).