 English
  Русский
 Bahasa Indonesia
 Bahasa Malay
 ไทย
ไทย Español
 Deutsch
 Български
 Français
 Tiếng Việt
 中文
中文 বাংলা
বাংলা हिन्दी
 Čeština
 Українська
 Română

To open long positions on EURUSD, you need:
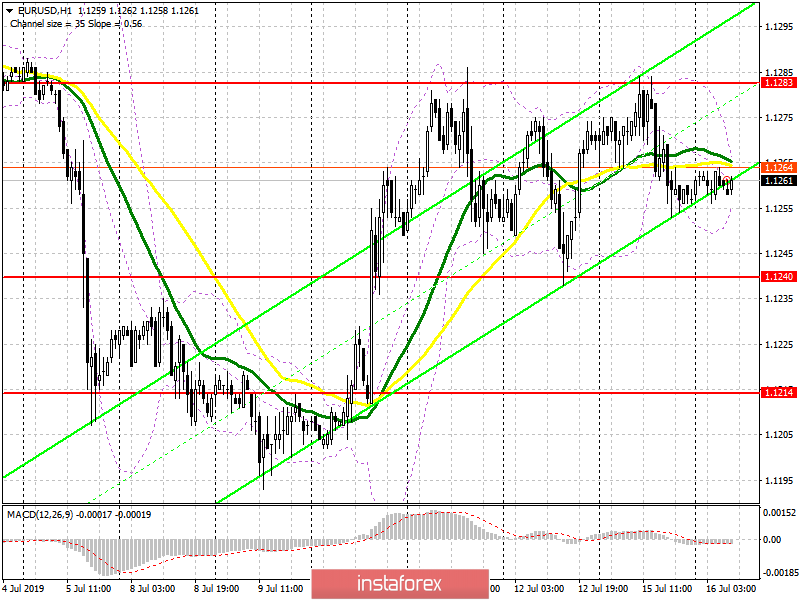
The situation has not changed compared to yesterday's forecast, except for the unsuccessful breakdown of the resistance of 1.1285. For continued growth, a breakthrough and consolidation above this maximum is required, which will push the euro higher in the area of 1.1311 and 1.1338, where I recommend taking the profit. In the EUR/USD decline scenario, after the release of weak reports on the sentiment index in Germany and the eurozone, you can look at long positions after a false breakdown in the support area of 1.1240 or a rebound from a larger minimum of 1.1214.
To open short positions on EURUSD, you need:
Bears coped with the task and did not let the euro above the resistance of 1.1285. Weak reports on the eurozone economy, which are expected today in the morning, may put more pressure on the euro, which will lead to a breakout of the support of 1.1240, below which the pressure on the pair will increase even more. This will open a direct road to the lows of 1.1214 and 1.1182, where I recommend taking the profit. In a scenario of growth of EUR/USD in the first half of the day, it is possible to sell on the condition that a false breakdown is formed in the area of 1.1283 maximum or for a rebound from larger resistance levels of 1.1311 and 1.1338.
Indicator signals:
Moving Averages
Trade is conducted just below the 30 and 50 moving averages, which points to market uncertainty.
Bollinger Bands
Volatility is very low, which does not give signals to enter the market in the middle of the side channel.
Description of indicators
- MA (moving average) 50 days – yellow
- MA (moving average) 30 days – green
- MACD: fast EMA 12, slow EMA 26, SMA 9
- Bollinger Bands 20