 English
  Русский
 Bahasa Indonesia
 Bahasa Malay
 ไทย
ไทย Español
 Deutsch
 Български
 Français
 Tiếng Việt
 中文
中文 বাংলা
বাংলা हिन्दी
 Čeština
 Українська
 Română

Trend analysis
This week, the price will move down from the first target of 1.2381 on the lower fractal. In case of further downward movement, the target will be 1.234 and the recoil level of 85.4% (yellow dotted line).
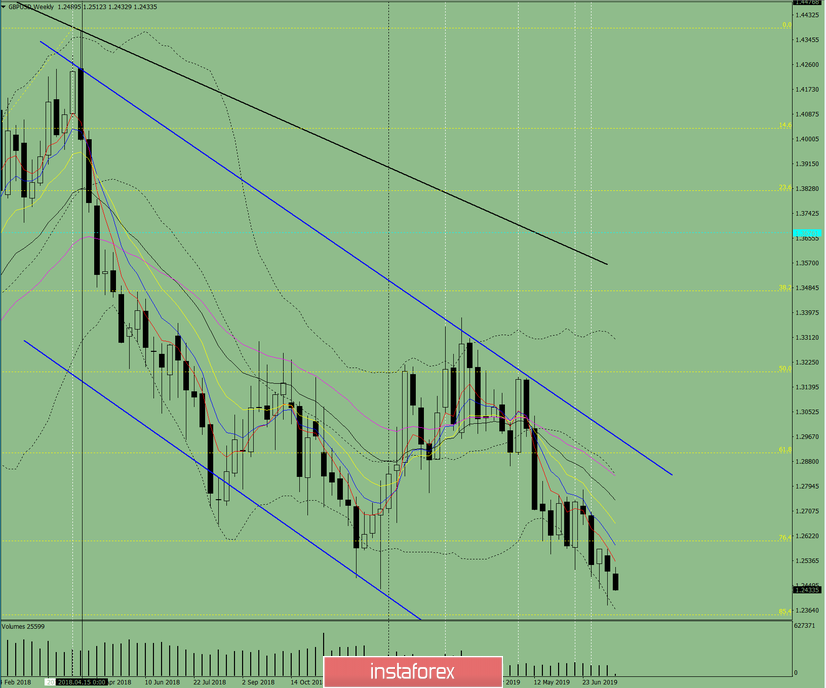
Fig. 1 (weekly schedule).
Comprehensive analysis:
- indicator analysis - down;
- Fibonacci levels - down;
- volumes - down;
- candlestick analysis is neutral;
- trend analysis - down;
- Bollinger lines - down;
- monthly schedule - down.
Conclusion on a comprehensive analysis - a downward movement.
The total sum of the total sum of the calculation of the GBP/USD candle on a weekly schedule: the price of the week is likely to have a downward trend with the absence of the first upper shadow from the weekly black candle (Monday - down) and the absence of the second lower shadow (Friday - down).
The price will move down with the first target of 1.2381 on the lower fractal.