 English
  Русский
 Bahasa Indonesia
 Bahasa Malay
 ไทย
ไทย Español
 Deutsch
 Български
 Français
 Tiếng Việt
 中文
中文 বাংলা
বাংলা हिन्दी
 Čeština
 Українська
 Română

On Tuesday, after breaking through the support line (red thin line), the price rallied down, testing the historical support level of 1.1144 (blue dashed line). On Wednesday, re-testing the support level is possible. The chances of rolling back up from this level are great. Strong calendar news is expected at 7.30 Universal time (euro), 14.00 Universal time and 14.30 Universal time (dollar).
Trend analysis (Fig. 1).
On Wednesday, the downward movement will continue to the level of support (blue dashed line) and then rolling back up with the first target 1.1186 - a pullback level of 14.6% (blue dashed line).
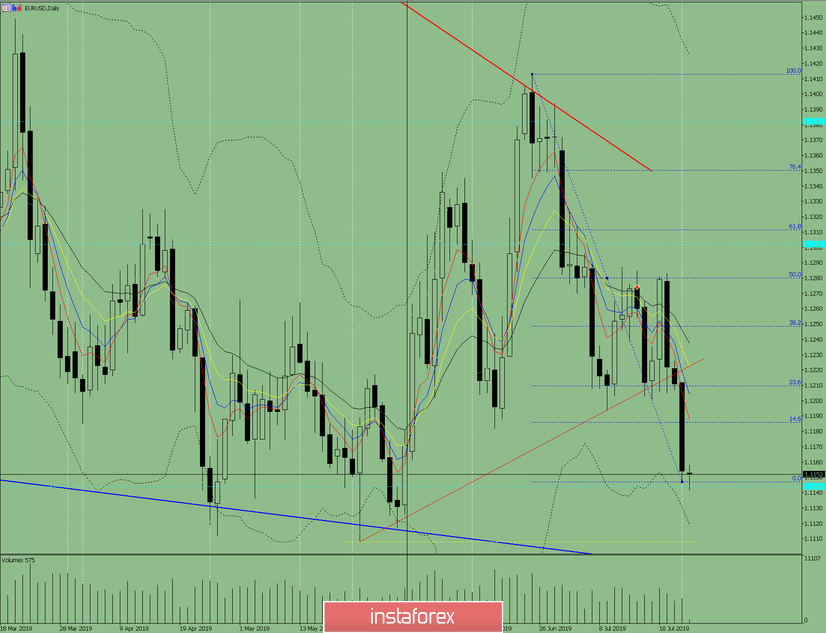
Fig. 1 (daily schedule).
Comprehensive analysis:
- indicator analysis - down;
- Fibonacci levels - down;
- volumes - down;
- candlestick analysis - up;
- trend analysis - down;
- Bollinger lines - down;
- weekly schedule - down.
General conclusion:
On Wednesday, the downward movement will continue to the level of support (blue dashed line) and then rolling back up with the first target 1.1186 - a pullback level of 14.6% (blue dashed line).